



Rebecca Dekker
PhD, RN

Sara Ailshire
MA, PhD
The Evidence on: What is a Due Date?
This article was originally published in 2015 and last updated January 21, 2026 by Rebecca Dekker, PhD, RN and Sara Ailshire, PhD. All Rights Reserved. Please read our Disclaimer and Terms of Use. For a printer-friendly PDF, become a Professional Member to access our complete library.
When someone becomes pregnant, they may receive a “due date” from their care provider at their first appointment. But what does this date actually mean, and how it is calculated?
In this Evidence Based Birth Signature Article® we review the evidence on due dates. This article helps answer questions like, “What is an estimated due date,” and “How is a due date determined,” and “What are the risks of going past your due date?” We will also share some of the most recent research on the science of due dates and on the risk of stillbirth.
Podcast Transcript
Dr. Rebecca Dekker – 00:01:40:
Before we dive into today’s very important episode, I wanted to share an exciting announcement. And that is, that tickets for the virtual 2026 Evidence Based Birth® conference are officially open today for the waitlist only. A few weeks ago I gave you a hint as to what one of our special evidence topics will be at the conference. I had said that we were covering a hot topic that begins with the letter “H.” Today, I can officially let you know that at the EBB conference, the EBB research team will be giving a brand new presentation covering the evidence on the Hepatitis B vaccine for newborns. This topic has been highly requested. So, if you want a front row seat at our virtual conference, go to ebbirth.com/waitlist to join the waitlist today for access to early bird tickets and a special post-conference bonus Q&A session with me. So, only those of you who are on the waitlist will receive an exclusive invitation to attend that bonus session. This is one of the perks the waitlist receives in addition to early bird pricing, when you register for the conference by Tuesday January 27th. If you have not had a chance to join the waitlist, but you’re really interested in this conference, and you would like early bird pricing and an invitation to the Q&A session with me – you can sign up at ebbirth.com/waitlist. After joining the waitlist the registration link will be sent immediately to your inbox. You can take advantage to the discounted pricing and the waitlist only bonus. And now, let’s get to today’s episode.
Hi everyone. On today’s podcast, we’re going to talk about the evidence on “What is a due date?” Welcome to the Evidence Based Birth® Podcast. My name is Rebecca Dekker, and I’m a nurse with my PhD and the founder of Evidence Based Birth®. Join me each week as we work together to get evidence-based information into the hands of families and professionals around the world. As a reminder, this information is not medical advice. See ebbirth.com/disclaimer for more details. Hi everyone, and welcome to today’s episode of the Evidence Based Birth® Podcast. Today I have a co-host with me, Dr. Sara Ailshire from Team EBB, is here with me to talk about some brand new evidence-based information about due dates. Dr. Sara has been on the podcast many times before, and I’m so excited to welcome you back.
Dr. Sara Ailshire – 00:02:36:
Hi, thank you so much for having me back on. I’m really excited to talk about everything that we’ve added to the article and the latest research on this topic. Updating these Signature Articles is a really big task, and it’s really fun to get to this point where we can actually share everything that we’ve been working on.
Dr. Rebecca Dekker – 00:02:52:
Yeah, and before we dive into the research, I just want to let you all know that if you want to access any of the written materials or scientific references that we mentioned on the podcast, it’s really easy. Just go to ebbirth.com/duedates and everything is there waiting for you. So to give a little bit of background, I originally published the Evidence on Due Dates in 2015. And we last updated that information in 2019. So the last podcast episode on this was way back in episode 51 that was published in 2018. So we’re recording this and this is being published in 2026. So this is a really big update for you all about due dates. We actually have a lot of new content coming out this year about due dates and induction. So you’re going to be hearing today about the Evidence on Due Dates. Later on this spring, we will be updating the Evidence on Induction for Due Dates. And we’ll be releasing that companion article to this one later this year. So as a content note, in today’s episode, we will be discussing stillbirth, which is defined as the loss of a baby at or beyond 20 weeks of pregnancy. Stillbirth touches the lives of so many birth workers, parents, and providers. And in the show notes, we’re going to share some resources that honor those babies that were lost to stillbirth and support parents and families affected by that type of loss. So with due dates, who might be interested in listening to this episode? What is there to learn about the science of due dates? Because doesn’t every pregnancy have roughly the same estimated length of 40 weeks? And why are some healthcare providers so concerned about pregnancies going past term? So in today’s episode, we’re hopefully going to be helping out those of you who might be pregnant now, or maybe you’re a healthcare provider or a birth worker. We’re going to cover what are due dates and what we know about how to date a pregnancy. We’re going to talk a little bit about ultrasounds, how they work, which is an important way that many pregnancies are dated. We will also talk about the risks of stillbirth at the end of pregnancy, what the latest research says on this, and what experts say you can do to help lower the risk of stillbirth. And of course, we’ll end by talking about the bottom line. So Dr. Sara, can you start us off by explaining what is a due date?
Dr. Sara Ailshire – 00:05:24:
Yeah, working on this update was the first time I’d ever really had a chance to sit down and dig into what we know about how long a pregnancy should last. And I think the first thing I should say is that a due date is really an estimate. It’s an educated guess, but it’s a guess for about how long a person could expect to be pregnant. It’s less important as a date of when you should expect to have a baby. It’s more helpful for helping you identify a range of dates. And when you’ll be at term, which is between 37 weeks and zero days pregnancy, an early term up to 41 weeks, six days for late term, and sometimes beyond. So generally speaking, the estimated due date is traditionally 40 weeks and zero days after the first day of your last menstrual period.
Dr. Rebecca Dekker – 00:06:16:
Okay. And so how does someone calculate that?
Dr. Sara Ailshire – 00:06:19:
So almost everybody, so doctors, midwives, and even those like online due date calculators you might use, they all use something called Naegele’s Rule to figure out the estimated due date. Naegele’s Rule assumes that you have a 28 day menstrual cycle and that you ovulate exactly on the 14th day of your cycle. And I should note that some healthcare providers will be able to adjust your due date for a longer or shorter menstrual cycle. So for a little bit of math to calculate your estimated due date or your EDD, using Naegele’s rule, you’ll add seven days to the first day of your last period and then count for nine months or you could count backwards three months. So that’s about equivalent to 280 days from the start of your last period. So say you have your last menstrual period on April 4th, you’ll add seven days. That brings you up to April 11th. Then you can subtract three months or go forward nine months. Either way, that’ll bring you to an estimated due date of January 11th. Another way to think about it is saying that your estimated due date is 40 weeks after the first day of your last period. So in cases where you know exactly when you conceive, so like with IVF or if you’re a very diligent fertility tracker where you might know your ovulation day, you can calculate the estimated due date by adding 266 days to the known date of conception or by subtracting seven days and adding nine months. This can increase the accuracy of that guess because it no longer assumes a 14-day ovulation based on the first day of the last menstrual period. But if you’re listening to this and you’re like, okay, Sara, but my menstrual cycle is like 30 days. That’s a really good point. And that is one of the big problems with Naegele’s rule. It assumes a lot of things that are not true for most people. Lots of people’s cycles vary in length. You know, when I was tracking mine prior to conception, I think I was averaging like 26 days, for example. So people go longer, well into 30 days, right? People can ovulate earlier or later. And sometimes even after the egg has been fertilized, it doesn’t automatically implant. Those eggs can wander around and take their time in there a little bit, right? So there’s a number of things that can affect, you know, the order of operations necessary for a pregnancy to begin. So that’s kind of where the, you know, tried and true numbers in Naegele’s Rule kind of fall apart, right? It’s a guess, but it’s not the best guess. So for this reason, an ultrasound between 11 and 14 weeks of gestational age is the best method that we currently have for accurately or most accurately, I should say, dating a pregnancy. And during this ultrasound, rather than sort of just using those dates of like when you had your period and the ultrasound technician will take measurements of the fetus. And that is, they’ll use those measurements to kind of say, okay, this baby, this fetus is about, you know, this many weeks along. And it can give you the best estimate that we currently have for how long the fetus has been developing or how long you’ve been pregnant. So generally speaking, a lot of people get that initial ultrasound to confirm the pregnancy, and then they’ll go back in. And that second ultrasound that you get, that’s your dating scan. And again, it’s not perfect, right? Because bodies are different. Babies are different. They’re very educated guesses, but just sort of like our best chance of kind of figuring out how long you could expect to be pregnant.
Dr. Rebecca Dekker – 00:09:45:
Yes, I think it’s really interesting how that ultrasound can be more accurate than using the last menstrual period to date your pregnancy. But it makes sense because there’s a lot of flaws, as you mentioned, with using the last menstrual period. But I think one of the most important studies on this was published back in 2013 by Khambalia et al. And it was a really high quality study, and they were grouping ultrasound scans by less than seven weeks, seven to 10 weeks, 11 to 14 weeks, and beyond. And they found that the most accurate time to perform an ultrasound to determine the gestational age was 11 to 14 weeks. So about 68% of people in the study gave birth within plus or minus 11 days of their estimated due date, as calculated by that ultrasound at 11 to 14 weeks. And this was more accurate than any of the other timings of ultrasounds and more accurate than using the last menstrual period. But the accuracy of ultrasound starts to significantly decline starting at about 20 weeks. And if you’re using a due date that was calculated beyond 20 weeks, you’re going to have a much higher risk of your pregnancy or when you go into labor as being inaccurately identified as either preterm or postterm. So that’s why most guidelines recommend that you use an 11 to 14 week dating ultrasound as the best practice for dating a pregnancy. Sara one of the things we did when updating this article, we’ve always talked about the accuracy of ultrasounds to date a pregnancy, but we have been getting a lot of questions from parents asking, is it safe to get an ultrasound to date the pregnancies? Can you talk a little bit about that?
Dr. Sara Ailshire – 00:11:22:
Yeah, absolutely. So I think we’re going to talk a little bit actually about what an ultrasound is. So ultrasound uses sound waves to create an image of what’s happening inside the body. And the image that you get is created by the ultrasound as a sonogram or like literally like a sound picture. That’s that little, you know, if you go, you get your ultrasound, you have your little bean or your little baby, like that’s the picture you have, right? Obstetric ultrasounds can tell us lots of information. They can help us, you know, make sure that organs are where they’re supposed to be. They can give information about, you know, how big the baby is. Not perfect, not a hundred percent. Of course, they can show us information about the placenta and other important body structures in pregnancy. And there’s lots of reasons why you would want to have an ultrasound during pregnancy. Use it to estimate gestational age. It can help us identify potentially life-threatening problems like placenta previa or placenta accreta, where there’s problems with the placenta’s connection or position in the uterus. It can help us detect differences of development in the fetus that can allow families to make informed medical decisions. It can provide a lot of reassurance to parents who’ve experienced pregnancy loss. It can facilitate bonding and it can, you know, again, give us a way to try to estimate or attempt to estimate fetal size. But some people prefer not to have ultrasounds during pregnancy. And that’s something that I learned as we were working on this update about why people are hesitant or concerned, like what the fear is around ultrasounds. So some people think that they’re unnecessary if they’re unwilling to terminate a pregnancy for any reason. Some people believe that ultrasounds have no value as a tool for monitoring a pregnancy’s progression or for diagnosing problems in a pregnancy. And some people believe that ultrasounds are harmful because of the sound waves that are used to generate the picture, the sonogram. So if you’re a person who’s in that boat or you’re, I’m not sure, I don’t know, like what happens with those sound waves. So you should be reassured to know that the research hasn’t identified any health risks of using standard ultrasound waves during pregnancy care. However, it’s not possible for us to prove the complete absence of risk because sound waves used in ultrasound scans are a form of energy that can create heat and can have a slight physical effect on tissues. It can be helpful to think about how extremely loud sounds can cause speakers to rattle or how a softer sound can make you feel you have a gentle vibration in your body. Because of the potential of sound to affect tissues, ultrasound professionals try to limit exposure to sound waves as much as they possibly can during an ultrasound by using a standard known as ALARA, or as low as is reasonably achievable. So ALARA, the standard includes really strict guidelines around sound wave like strength and the time limits during the ultrasound. So all this means is that ultrasound technicians use the lowest intensity of sound waves for the shortest amount of time possible to get a good picture. And this ALARA principle is actually also why professional bodies that regulate, you know, ultrasound and ultrasound technician training recommend against those keepsake ultrasounds. Many people, I should say, want to see that their baby looks like, but generally speaking, if there’s not a need, you know, either to like determine where you are in pregnancy or check, you know, make sure that everything is developing well, and that organs and placentas and everything are where they’re supposed to be, then it’s not recommended to have an ultrasound just sort of recreationally. So that was something I learned during this research, I thought was super interesting, because I was pregnant not that long ago. And like, we considered going in just, you know, you want to see how everyone’s doing in there. But if there’s not, you know, again, like a documented need for ultrasound, following that principle of, you know, reducing risk, even though we know that the risks are very, very low, that’s not something that’s recommended.
Dr. Rebecca Dekker – 00:15:18:
Yeah. So avoiding those like storefronts where you go in to just get like, feels like tourism of, you know, a picture with your baby is what should be avoided. But brief ultrasound to date the pregnancy is generally considered to be safe. And that’s widely accepted among healthcare organizations. So very interesting. And I do know that the dating ultrasounds tend to be a very short, quick, take a picture, measure the fetus. And I think it’s important to know that those measurements to date the pregnancy are going to be more accurate earlier in pregnancy because early in pregnancy, embryos and fetuses develop at a very specific timeline. But later in pregnancies, when you start to see differences in how we are built, you know, where maybe your partner is really tall. So your baby’s growing extra big. That doesn’t mean they’re older inside the uterus. It just means that’s what they’re going to end up being a taller person. So that’s one reason why the earlier, that 11 to 14 week period is the best time period to get the dating.
Dr. Sara Ailshire – 00:16:17:
Yeah, absolutely. So Rebecca, we talked a little bit about how we estimate pregnancy length and the markers that we use to plot our course. But 40 weeks, as we all know, isn’t a magic number. So would you be able to talk a little bit about the reality of how long pregnancies actually are compared to these estimates?
Dr. Rebecca Dekker – 00:16:38:
Yeah. So it’s actually kind of tricky to study the length of pregnancy. So a long time ago, researchers used to try and estimate how long the average pregnancy would go by, you take a large group of people. You’d measure the time from ovulation or from their last menstrual period or the date on an ultrasound. And then you would measure how long it would take for them to go into labor and give birth. And then you would just kind of calculate the average. But this method is completely inaccurate. And one of the reasons it’s inaccurate is because many people are induced maybe at 39 weeks or earlier, maybe 40, 41 weeks or later. And so if you’re including people who were induced in your average length of pregnancy, then you are including people who gave birth earlier than they would have if they hadn’t been induced because with an induction, they were not able to go into labor on their own timeline. And we have many, many people being induced today at 39, 40 weeks, especially after the ARRIVE trial, which we’ve talked a lot about on this podcast. But this really puts researchers in a bind because you can’t just throw out all those people who have inductions. For example, let’s say you exclude someone who was induced at 41 weeks from your study, then you’re ignoring a pregnancy that was induced because it was going longer. And so by excluding that case, you artificially make the average length of pregnancy too short. So how do we deal with this issue? There is a statistical method called time to event analysis, and sometimes it’s called survival analysis. This is a special method I used to use when I did cardiovascular research when we were looking at time to an event. How long does it take for something to occur? And it’s a special method that allows you to include everyone in your study and still get an accurate picture of how long it would take the average person to go into labor on their own. So there are two studies that have used this method. They’re both older studies. One was published by Smith in 2001. One was published by Jukic in 2013, but they’re still really relevant. You can throw that rule out, the rule that says only use a study if it was published in the last five years. Sometimes we can’t do that in birth work because there is no research or because we have a really like what we call a landmark study. And I don’t think the results will have changed, but what we have with these data, they’re really important. One study that was published by Smith, they had about 1500 healthy pregnant women. Their estimated due dates that were calculated by their last menstrual period were a perfect match with their first trimester ultrasound estimate. And they found that half of everyone in the study gave birth for the first time by 40 weeks and five days. So instead of using the average or the mean, we’re using the median, which is kind of like the halfway point. Well, 75% gave birth by 41 weeks and two days. Meanwhile, half of all women who had already given birth in the past at least once gave birth by 40 weeks and three days, while 75% gave birth by 41 weeks and zero days. So this means that 40 weeks and zero days was not like where most people went into labor. Actual pregnancy length was about five days longer than the traditional due date of 40 weeks, if you’re giving birth for the first time. And it was three days past 40 weeks if you had given birth before. So that was the Smith study. There was another study, it was a lot smaller, the Jukic study only had 125 healthy pregnant women in the study and they were giving birth like in the early 1980s. However, this is one of the most important studies we have on this topic because they began following these people even before they conceived. They were measuring their hormones daily for six months. So they knew like the exact day people ovulated, the exact day that conception happened and they even knew the exact day that the pregnancy implanted in the uterus. So after they excluded anybody with medical complications or preterm births, the final sample of 113 women had a median time from ovulation to birth of 38 weeks, two days after ovulation. But the median time from the first day of the last menstrual period to birth was 40 weeks, five days after the last menstrual period. And they also found that only 10% gave birth by around 39 weeks and half, like I said earlier, gave birth by 40 weeks, five days. 75% gave birth by 41 weeks and two days. And then they also looked at more specifically ovulation. We have that information in the Signature Article. So if you want to look at the statistics of like, when exactly did people tend to give birth after they ovulated and conceived, you can see that in the article as well. I thought it was really interesting that the longer the embryo took, like that fertilized egg, the longer it took to implant in the uterus to kind of embed itself in the uterus, the longer the pregnancy. So it’s not just the day you conceive, but it’s also the day the pregnancy implants. And so really based on best evidence, there is no such thing as an exact due date. It is just like you said, Sara, earlier, it is an educated guess. And it’s also more appropriate to say that there is a normal range of time in which most people will give birth. So about half of people will go into labor on their own by 40 weeks and five days if it’s their first baby, and about half will go into labor by 40 weeks, three days if you’ve given birth before. The other half would not, unless of course they were induced or had a Cesarean.
Dr. Sara Ailshire – 00:22:27:
Yeah, absolutely. And something that I thought was really interesting when we were doing this update is that there are some people who are just like compared to the average, more likely to have longer pregnancies. The most important predictor of this likelihood of having a longer pregnancy was having a family history of longer pregnancies. So that could be your own people who have mothers or sisters who have longer pregnancies, as well as the babies, other genetic parents, their family history. There’s a 2013 study by Oberg that looked at over 475,000 births in Sweden that were dated by ultrasound before 20 weeks. They found that genetics had an incredibly strong influence on your chance of having a birth after 42 weeks. Another thing that they looked at in the study was looking at trends and pregnancies in the same person. So in their study, they found that if you’ve had a post-term or birth after 42 weeks before, you’re 4.4 times more likely to have another post-term birth if you are pregnant with the same other genetic parent. If you’ve had a post-term birth before and you switch partners, you’re 3.4 times more likely of having a post-term birth with your new partner. And if your sister had a post-term birth then you’re 1.8 times more likely to have, again, like a post-term 42 week plus birth. So that’s a really strong influence because those very, very long pregnancies are not particularly common. Overall, researchers found that half of your chance of having a post-term birth comes from genetics. This includes the baby’s genetics, their genetic tendency to gestate for longer due to both the genes that they inherit from their birthing parent, as well as the other genetic parent, as well as the pregnant person’s genetic tendency to carry a pregnancy for longer. In addition to this study by Oberg, we found a number of other studies that covered factors that could cause a pregnancy to go for longer. And these included having a higher body mass index or BMI before you get pregnant, having just in general an increased weight gain during pregnancy. A longer time between when you ovulate and when your pregnancy implants. Older maternal age, so 35 plus. How heavy you were yourself as a baby, so heavier birth weight of the pregnant person. Having a higher education level. Being pregnant for the first time. Being pregnant with a male baby. Exposure to a stressful event. And these were studies that looked at things that included natural disasters and 9-11 in the United States later in pregnancy. Have some kinds of fetal anomaly or fetal genetic condition can cause a longer pregnancy. However, in a lot of cases, for all these different factors that were covered or identified as something that could increase the likelihood that you’d have a longer pregnancy. There’s a lot of cases where we just don’t know exactly why somebody might have a longer pregnancy or might have longer pregnancies compared to other people. So we know that some people have longer pregnancies than others. And we know that 40 weeks is just an educated guess. So what is a concern then that a lot of people hear about being pregnant beyond 40 or 41 weeks?
Dr. Rebecca Dekker – 00:25:41:
Yeah. So the primary concern with going beyond your due date is that the risk of complications increases beyond the 40 to 41 week mark. And in the full link Signature Article, you can get at ebbirth.com/due dates, we’re going to outline for you a few studies that going back the past 20 years that look at risks across different gestational ages of pregnancy, mainly looking at 37 weeks to 42 weeks and beyond. So some risks researchers identified as increasing as pregnancy continues from 37 to 42 weeks include infections such as chorioamnionitis or endomyometritis and placental abruption. A placental abruption is rare, but the risk does gradually go up. Different studies show a general increase in the likelihood of having a Cesarean or a vacuum or forceps assisted birth as pregnancy advances. The risk of hemorrhage also generally increases bit by bit. And some risks increase to a point and then seem to level off like the risk of preeclampsia. For babies, researchers have identified an increased chance of having moderate to thick meconium or stool in the amniotic fluid, which is the baby’s first poop happening before the baby is born. NICU admissions, the chance of having a big baby and the chance of your baby having low APGAR scores. But by far, the biggest concern researchers focus on with going past your due date is the risk of stillbirth. So I wanted to talk more in depth about that. And if you want some of the exact statistics of the other risks I’ve talked about, like I said, many of those are rare, but the risks gradually go up. You can see those in the full-length Signature Article. So with stillbirth, it’s really interesting because up until the 1980s, most researchers and many doctors thought that the risk of stillbirth at 41 to 42 weeks was really similar to the risk of stillbirth earlier in pregnancy. So there was not a lot of pressure to induce before the 1980s because they thought, you know, the risk does not go up. However, in 1987, a researcher published a paper basically explaining that the earlier researchers were all using the wrong math when they were calculating stillbirths. You know, whenever you’re trying to calculate a rate or a percentage, you have a numerator and you have a denominator. Basic fraction math, which, you know, if you haven’t been in elementary or middle school for a while, you have to go back and review. But when you’re looking at math, Dr. Yudkin found that they were all using the wrong denominator. When calculating the fraction, we don’t need to know how many stillbirths happen out of every 1000 births at 41 weeks. Instead, we need to know how many stillbirths happen at 41 weeks compared to everyone who’s pregnant or gives birth at 41 weeks. So you have to include all the healthy babies that are still living in utero in your denominator. So when you include everybody in the denominator that you’re supposed to, they found something very surprising. They found that the risk of stillbirth goes down throughout pregnancy and it reaches a low point at 37 to 38 weeks after which the risk starts to rise again. And this finding has been repeatedly found by different researchers in different countries all over the world at different time points. And it’s known as the U-shaped curve of stillbirth. So we have higher rates of stillbirth earlier in pregnancy, like closer you are to 20 weeks. Then they decline until you get to 37 to 38 weeks after which they rise again. Now the risk of stillbirth is still very low at 37, 38, 39, 40 weeks, even though it’s going up. But what happens is at 41 weeks, there seems to be a more substantial increase in the risk of stillbirth. And some researchers argue that although the physiological length of a pregnancy is around 40 weeks in three to five days, they say, well, 40 weeks and zero days may be the more functional length of a pregnancy. In their opinion, because of the increased risk of losing your baby, 40 weeks may be as long as the pregnancy should go. This is one of the major motivating factors behind the ARRIVE trial, looking at induction at 39 weeks, which has since led to an increase in inductions at 39 weeks without seeing any benefit to lowering stillbirth rates, including in the study itself. Now, in the article, we go into depth in some of the more recent studies about stillbirth rates, and you will find that these rates vary from study to study, depending on who they’re including in the study, and how they’re reporting the stillbirth rates, because there’s even more math they can do to look at the risk of stillbirth. In the United States, the stillbirth rate is 5.7 per 1,000 deliveries, or one out of every 175 pregnancies, according to the latest CDC data published in 2025. And although that risk may seem low overall, if you happen to be the family that experiences that one in 175 event, then the risk doesn’t seem so low to you personally anymore. So, Sara, I know you dug really deep into the research on stillbirth. Can you share some of what you found with us?
Dr. Sara Ailshire – 00:31:07:
Yeah, absolutely. So in the article, we included some summaries of large studies that looked at the risk of stillbirth after the estimated due date. And these were studies from Norway, Germany, and the U.S.. And again, kind of like we’ve discussed before, some of this data is older but still relevant. However, I wanted to talk about the most recent study that we looked at that was published in 2023. In this Signature Article, we included summaries of several large studies that looked at the risk of stillbirth after the due date. These studies come from Norway, Germany, and the U.S.. Of these studies, though, a 2019 study by Mugloo et al., remains one of the largest meta-analyses that we have on this topic. These researchers looked at 13 studies that included over 15 million pregnancies. And of the people, of the pregnancies included in their study, that also included 18,000 stillbirths. All of the studies that they looked at were carried out in four countries defined as being high income by the World Bank. So Denmark, Norway, U.K., and the U.S. So in this study, researchers stratified or organized the risk of stillbirth based on gestational week. So at 37 weeks, their research identified 0.11 stillbirths per 1,000 pregnancies and births. At 38 weeks, that increased to 0.16 per 1,000. At 39 weeks, 0.42 per 1,000. 40 weeks, 0.69 per 1,000. And here we see that jump that we talked about with a U-shaped curve. At 41 weeks, they saw 1.66 stillbirths per 1,000. And at 42 weeks, they saw 3.18 per 1,000. So based on their data, Mugloo et al., the researchers calculated the number needed to harm with waiting for labor to begin on its own. This number tells you how many people would need to wait for labor for one more week in order to experience one additional stillbirth. To experience one additional stillbirth, there would need to be at least 2,367 people waiting for labor for one more week beginning at 39 weeks. At 40 weeks, 1,449 people would have to wait for labor for one more week to experience one more additional stillbirth. At 41 and 42 weeks, those numbers drop. So at 41 weeks, only 604 people would need to wait one additional week to experience a stillbirth. And at 42 weeks, 315 people would have to wait for labor for one more week to experience an additional stillbirth. These researchers also found evidence that the healthcare system was failing Black mothers and Black babies. In the research study, Black mothers were 1.5 to 2 times more likely than White mothers to have a stillbirth at every week of pregnancy. When these researchers also looked at only low-risk pregnancies, they found a little bit of a difference in the risk of stillbirth. At 38 weeks, they saw 0.12 per 1,000. At 39 weeks, 0.14 per 1,000. At 40 weeks, 0.33 per 1,000. 41 weeks was 0.80 per 1,000. At 42 weeks. 0.88 per 1,000. Low-risk pregnancy in this study was defined as pregnancies that had a single baby with no congenital differences of development, no complications of pregnancy. They found no additional risk of newborn death when giving birth between 38 and 41 weeks, but the risk of newborn death did increase beyond 41 weeks. So although most researchers have found an increase in stillbirth rates in the late term and post-term period, some might consider the absolute increase in risk to be small until 41 weeks, after which it reaches between 0.80 and 1.66 out of 1,000 pregnancies and births, depending on the presence of other risk factors. So we know that generally speaking, stillbirth rates start to increase after 41 weeks, but there are also some other factors that can affect the risk of stillbirth.
Dr. Rebecca Dekker – 00:35:12:
And what are those?
Dr. Sara Ailshire – 00:35:13:
Yeah, so we identified a few factors in our update for the Signature Article. The first group of factors we can talk about are fetal risk factors. And these can include things like congenital abnormalities, male sex, RH incompatibility between the fetus and the pregnant person, and being small for gestational age. A 2023 research study reviewed data from over 125 million births across 13 countries. And this study identified being small for gestational age either at preterm, so before 37 weeks, or at term as being an important risk factor for stillbirth. However, I think it’s really important to note that being small isn’t necessarily a problem in and of itself. Rather, being small for gestational age can be an indication that there’s a health problem in a pregnancy or that something is going on with a placenta. So, sure, people having small babies is not necessarily surprising. But if the baby is much, much smaller than you would expect it to be, then that can be a sign that, hey, something might be going on. And this brings me to the second risk category that we looked at, which was placental risk factors. The placenta is the organ that nourishes the baby throughout pregnancy. So if problems arise with the placenta, the baby’s life support, or the umbilical cord that connects the baby to the placenta, then stillbirths can occur. So these can be emergent or emergency events, like the separation of the placenta from the uterus and the abruption. Or it can be chronic issues with the placenta, like premature aging. Conditions like preeclampsia, hypertension, or diabetes can also negatively impact the placenta’s ability to function, which can increase the risk of stillbirth. Another risk category that we identified were maternal risk factors. These are sometimes referred to as maternal characteristics that are associated with an increased risk of stillbirth. These can include things that no one can help, right? Like being pregnant with your first baby, having fewer than four prenatal visits, having no prenatal care, experiencing poverty, and having a high BMI. These can also include things like smoking, type 1 or type 2 diabetes, having hypertension prior to the beginning of pregnancy, being very young, so under the age of 18, or being over the age of 40, as well as having a history of previous stillbirth or being pregnant with more than one baby, like having twins or triplets. The final risk category that we wanted to highlight is racism. White supremacy is harmful to the well-being of pregnant people and to their babies. The most recent numbers that we have from the U.S., find that the overall stillbirth rate, so from 20 weeks onward, is more than twice as high for Black pregnant people than for white pregnant people, at 9.95 per 1,000 for Black pregnant people compared to 4.55 per 1,000 stillbirths for white pregnant people. Native Hawaiian and Pacific Islanders, American Indian and Alaska Native pregnant people also face disproportionately high rates of stillbirth based, again, on the latest data that we have in the U.S. So I know it can be hard to hear all of this. I found it to be really difficult myself when I was drafting the article update and preparing for the podcast episode. And something that we get asked when we’re talking about the topic of stillbirth is if there’s something that people can do. People want to do what they can if it’s possible to prevent this from happening. So Rebecca, could you talk a little bit about what pregnant people can do?
Dr. Rebecca Dekker – 00:38:37:
Yeah. So obviously there are stillbirths that are completely unpreventable and every stillbirth is a tragedy. And there are many factors that we have no control over when we’re pregnant. There are some things we can do to lower the risk that does not guarantee that you will give birth to a healthy baby, but there are some things that we can do to improve the chances that things will turn out okay. Some of the work to lower the risk for everyone has to involve addressing structural inequalities that worsen the risk of stillbirth for pregnant people of color, as well as for people who lack access to adequate prenatal care. So, you know, maternity care deserts, the closure of hospitals that make it difficult for people to access prenatal care. As we mentioned earlier, like having supportive, adequate prenatal care lowers the risk of stillbirth. Some other steps individuals can take to potentially lower the risk of stillbirth include not smoking and not consuming illicit drugs during pregnancy, accessing prenatal care regularly, as we talked about, including getting screened for conditions such as gestational diabetes and preeclampsia. So things like home blood pressure monitoring could be helpful in screening for preeclampsia. Seeking midwifery care, there’s research showing that midwifery care can lower the risk of stillbirth. And then we often get asked about sleeping and sleep positions during pregnancy. And there is evidence that sleeping on one side rather than on their back, as you get towards the second half of pregnancy is helpful for lowering the overall risk of stillbirth. We have talked before in the podcast about fetal movement tracking or kit counting, and there is still mixed evidence on the effectiveness of this. So the goal of tracking your baby’s movements would to help you be aware of your baby’s movements so that if you notice a decrease or a change in the typical movement pattern that you could seek additional help and testing to determine whether or not additional interventions are needed or just make sure you’re not developing a pregnancy complication. So if you’re interested in learning more about the evidence on kit counting, we do include a section in the Signature Article on that where you can dive deeper into that research. So while the evidence on tracking fetal movements is unclear, what is important is that if you feel something’s wrong or you notice a difference in fetal activity, it is a good idea to contact your provider or go to the labor and delivery ward for testing. And we will link in the show notes to some episodes we’ve done about this in the past. You can learn more about Count the Kicks organization and about the Push documentary about stillbirth. So those are just a few things. And again, I want to emphasize that you could do all of those things and still experience a tragedy. We don’t want to put any blame on people, but I also do want people to feel like, because knowledge is power, right? And sometimes people ask, is it helpful to do this? Is it helpful to do that? Yes, it might be helpful to sleep on your side, but don’t be ashamed if you wake up and you happen to be on your back. That’s not something that you can help. So I do remember there was an interesting study I saw years ago where they actually had people put a tennis ball in like a pantyhose and tie it around their waist so that the tennis ball was on their back. And they found that it helped people stay on their side, which makes sense. I have not seen further research on that, but I thought that was interesting at the time. So anyways, we get that question a lot. It can be helpful, but at the same time, we can’t control everything we do while we’re sleeping. So keep that in mind. And Sara, is there anything you want to talk about that you found surprising in this article? Because you spent months digging into this research on due dates, kind of looking at it with fresh eyes. What was your takeaway or your surprising finding?
Dr. Sara Ailshire – 00:42:37:
The only thing that surprised me the most was, I think, you know, being in this field for a while, like, you know, both from my dissertation research and then working at EBB, you know, I was well acquainted with, you know, 40 weeks isn’t set in stone. It’s an estimate. But understanding a little bit more of the history of, you know, how many efforts there have been, like all the way back to like the Greeks, like trying to figure out how long pregnancies are supposed to last. And again, just that being one of those things that it’s surprising how much we don’t know still about pregnancy and like all the different things that have to occur from beginning to end. So I think that was so fascinating to me. It was just like, what we know about how long pregnancies should last, and then also what we don’t know. The other thing too that I thought was really affecting was just some of the research on stillbirth as well, the different communities who are more egregiously impacted by it, as well as some of the things that people can do. Again, I think it’s something that was really important to learn and was just grateful for the opportunity to sit with that research. What’s that thing from Mr. Rogers? When you’re dealing with something hard, looking for the helpers, getting to see some of the important work that researchers are trying to do to help us better understand this, address this, and try to fight this problem in pregnancy. It was tough, but it also made me feel glad that there’s some really smart people out there putting their heads together on this and trying to find some better ways forward.
Dr. Rebecca Dekker – 00:44:06:
Agreed. I think that the connection between due dates and stillbirth can sometimes be almost either people underplay the risk. They will say things like, well, your body’s meant to go into labor when it goes into labor and you need to trust your body and trust birth. But say that to somebody who’s lost their baby, doesn’t make sense. But at the same time, we see also on the other side, we’ll see fear mongering of like, there’s a 50% chance higher your baby will die in the next week, but they don’t actually show you the absolute risk is still low. And I think every family deserves to have access to the actual numbers. And that’s one reason we put this article together so that that can be freely available. You know, it’s confusing sometimes to listen or to watch a video talking about these statistics. So if you want to just go to ebbirth.com/duedates, and we have a free one page handout for you on what is a due date. And then all of the numbers are in there from these studies about the actual risks. For me, I think we added a little section we didn’t talk about yet on the podcast about the aging of the placenta. I think you briefly mentioned it, Sara. So I think that is another thing we hear a lot is that parents are told by their providers that your placenta is getting old. Right? That has been around for decades. I hear people talk about this all the time. And I find it fascinating that we can only find two studies on the aging of the placenta. So, you know, there was a study in 2017. It was the first study we could ever find looking at biological markers of aging in placentas. And it was a small study. Often these like biological sample studies are small because they do these really complicated tests on the organ. And with this, they did find an increase in DNA and RNA damage in late birth placentas and placentas that came from stillbirths compared to placentas from 37 to 39 weeks. And, you know, that was a small study, but it does give us some interesting data to like start from. The other study was from 2019, and these were researchers from Spain, and they compared the placentas of 21 babies born at term who were typical in size to 18 babies born at term who were classified as small for gestational age. And then also they looked at more placentas from babies who were classified as having fetal growth restriction. And they found that placentas of the small for gestational age babies and the fetal growth restricted babies showed the same signs of premature aging of the placenta, which may be why those babies were not growing. Then we talk more, Sara, you added a whole section about small for gestational age. We didn’t even go into that and how that is probably one of the fetal growth restriction, I should say more specifically, is one of the biggest risk factors for stillbirth. And we talk more about that in the article.
Dr. Sara Ailshire – 00:47:04:
Yeah, absolutely. This is definitely, you know, there’s so much more that we get into with the article than we can get into here. So just, you know, if you have a chance, please go check it out. If you’re curious about anything that we’ve mentioned here, you want to know more about.
Dr. Rebecca Dekker – 00:47:16:
So the bottom line is a few things I want to summarize for you. I think we can all agree that the traditional way of calculating the estimated due date is not 100% accurate. Instead, it’s more accurate to give people a range of time in which they will probably go into labor on their own, which we talked about it being 40 weeks, five days for about half of people, if it’s their first baby, and 40 weeks, three days. And about half of people who have given birth before will give birth by 40 weeks and three days. The estimated due date can also be calculated using ultrasound, which is more accurate than using the last menstrual period. And that ultrasound accuracy is highest if it’s done between 11 and 14 weeks of pregnancy. And there are a lot of studies showing that there is an increase in the risk of stillbirth towards the end of pregnancy. Although some might consider the overall or absolute increase in risk to be small until you reach 41 weeks and later. Certain characteristics, such as it being your first pregnancy or pregnancy where the baby is growth restricted, can pose a higher risk for experiencing stillbirth in late pregnancy compared to other people. And there are actions we can take as a whole, as a population to help lower the risk of stillbirth, but some stillbirths are not preventable. And we need more research on this topic. I also want to say some people that leads us to inducing for due dates. Like when do you time an induction if you’re trying to lower the risk of stillbirth, but still give your body a chance to go into labor on its own. We’ll talk about that in the companion article, all about being induced for reaching around 41 weeks. And that article is coming out later this spring. So keep your eyes open for the podcast and the article on that subject. So Sara, thank you again for all your help. And we are so excited to launch this updated due dates article out into the world.
Dr. Sara Ailshire – 00:49:11:
Yeah. And I think we have a new handout that goes with this one.
Dr. Rebecca Dekker – 00:49:14:
Yes. The evidence on What is a Due Date is available at ebbirth.com/duedates. So check it out. Today’s podcast was brought to you by the Signature Articles at Evidence Based Birth®. Did you know that we have more than 20 peer-reviewed articles summarizing the evidence on childbirth topics available for free at evidencebasedbirth.com? It takes six to nine months on average for our research team to write an article from start to finish. And we then make those articles freely available to the public on our blog. Check out our topics ranging from advanced maternal age to circumcision, due dates, big babies, pitocin, vitamin K, and more. Our mission is to get research evidence on childbirth into the hands of families and communities around the world. Just go to evidencebasedbirth.com, click on blog. And click on the filter to look at just the EBB Signature Articles.
What does it mean to be “full term?”
Most people know that a pregnancy is supposed to be nine months long. In reality, the length of time a complete pregnancy can last varies from person to person.
The meaning of “term” in pregnancy refers to the length of time someone can, on average, expect to be pregnant. The expectation was that babies born at term would generally have good outcomes, and not struggle with any challenges associated with prematurity (being born before their bodies are developed enough to adapt to life outside the womb) (ACOG 2013, reaffirmed 2025). For many years, a baby was defined as being born at “term” if it was born between 37 weeks 0 days and 41 weeks 6 days. Anything before that 5-week period was considered “preterm,” and anything after those five weeks was “post-term.”
Over time, though, research began to show that health problems are more common at certain points during the 5-week “term” period. In particular, newborns are more likely to die (although the overall risk is still very low) if they are born before 39 weeks, or after 41 weeks.
The chance of a newborn having problems is lowest if he or she is born between 39 weeks and 0 days and 40 weeks and 6 days (Spong 2013).
In 2012, a group of experts came together to define term pregnancy. Based on their review of the research evidence, they broke the 5-week term period into separate groups (Spong 2013).
- Early term babies are born between 37 weeks 0 days and 38 weeks 6 days
- Full term babies are born between 39 weeks 0 days and 40 weeks 6 days.
- Late term babies are born between 41 weeks 0 days and 41 weeks 6 days
- Post term babies are born at 42 weeks and 0 days or later
You might hear a practitioner refer to a baby being born “at term” at 37 weeks, but these new groupings help providers and families better understand where a baby might fall along the spectrum in terms of health needs and potential risks they might experience at birth.


This Signature Article focuses on the evidence on determining due dates.
To read our separate Signature Article all about the Evidence on Inducing Labor for going past your Due Dates, click here.
How do you figure out your estimated due date?
The estimated due date (EDD) is traditionally 40 weeks and 0 days after the first day of the last menstrual period. Almost everyone—including doctors, midwives, and online due date calculators—uses Naegele’s rule (listen to the pronunciation here) to figure out an estimated due date (EDD) (Lawson 2021).
Naegele’s rule assumes that you had a 28-day menstrual cycle, and that you ovulated exactly on the 14th day of your cycle (Note: some health care providers will adjust your due date for longer or shorter menstrual cycles).
To calculate your EDD according to Naegele’s rule, you add 7 days to the first day of your last period and then count forward 9 months (or count backwards 3 months). This is equal to counting forward 280 days from the date of your last period.
For example, if your last menstrual period was on April 4, you would add seven days (April 11) and subtract 3 months = an estimated due date of January 11.
Another way to look at it is to say that your EDD is 40 weeks after the first day of your last period.
In cases where the date of conception is known precisely, such as with in vitro fertilization or fertility tracking where people know their ovulation day, the EDD is calculated by adding 266 days to the date of conception (or subtracting 7 days and adding 9 months). This increases the accuracy of the EDD because it no longer assumes a Day 14 ovulation based on the first day of the last menstrual period.
But where did Naegele’s rule come from?
For a long time, people have tried to work out exactly how long a pregnancy should be. Hippocrates in classical Greece estimated that pregnancies should be roughly 280 days in length, or a little over nine months (Drife 2021).
In 1744, a professor from the Netherlands named Hermann Boerhaave explained how to calculate an estimated due date. Based on the records of 100 pregnant women, Boerhaave figured out the estimated due date by adding 7 days to the last period and then adding nine months (Baskett & Nagele 2000).
However, Boerhaave never explained whether you should add 7 days to the first day of the last period, or to the last day of the last period.
In 1812, a professor from Germany named Carl Naegele quoted Professor Boerhaave and added some of his own thoughts. (This is how Naegele’s rule got its name!) However, Naegele, like Boerhaave, did not say when you should start counting—from the beginning of the last period, or the last day of the last period.
His text can be interpreted one of two ways: either you add 7 days to the first day of the last period, or you add 7 days to the last day of the last period.
As the 1800s went on, different doctors interpreted Naegele’s rule in different ways. Most added 7 days to the last day of the last period.
However, by the 1900s, for unclear reasons, American textbooks adopted a form of Naegele’s rule that added 7 days to the first day of the last period (Baskett & Nagele 2000). A possible explanation is that Nagele’s initial writing was vague and only in later editions in the original German did he clarify what he meant, updates that were possibly not included in other medical texts (Loytved & Fleming 2016).
This brings us to today, where almost all doctors use a form of Naegele’s rule that adds 7 days to the first day of your last period, and then counts forward 9 months—a rule that is not based on any current evidence, and whose origins are subject of some debate to this day (Loytved & Fleming 2016).
Why is it important to know how far along I am?
There are a few reasons why establishing an estimated due date and knowing how far along a person is in pregnancy is important.
Knowing your estimated due date, even though it is a rough guess, can help families prepare for birth by setting up a space for the baby, taking time off of work, hiring a doula and/or care provider who will be available for the birth, and making arrangements for childcare or other supports they may need.
In addition to the logistical concerns, knowing your estimated due date can help you understand your baby’s growth and development during pregnancy. If your baby shows signs of being much smaller or much larger than expected for babies of the same gestational age, there may be underlying health issues that need to be addressed to protect the health of the pregnant person and the fetus (ACOG 2021). These can include gestational diabetes, genetic differences of development, gestational hypertension, preeclampsia, or potentially a problem with the placenta.
What is the most accurate way to tell how far along you are?
In the 1970s, health care providers started using ultrasound (which we describe later in this article) to estimate how long someone has been pregnant and determine their EDD. Soon after, ultrasound measurement replaced last menstrual period (LMP) as the most reliable way to define gestational age (Morken et al. 2014).
Many studies have shown that an ultrasound done in early pregnancy is more accurate at dating a pregnancy than using the LMP. In a 2015 Cochrane review, researchers combined the results from 11 randomized clinical trials that compared routine early ultrasound to a policy of not routinely offering ultrasound (Whitworth et al. 2015).
The researchers found that people who had an early ultrasound to date the pregnancy were less likely to be induced for a post-term pregnancy.
In other words, using the LMP to estimate your due date makes it more likely that you will be mislabeled as “post-term” and experience an unnecessary induction.
In a large observational study that enrolled more than 17,000 pregnant people in Finland, researchers found that ultrasound at any time point between 8 and 16 weeks was more accurate than the LMP. When ultrasound was used instead of a “certain” LMP (in other words, the mother is “certain” about the date she had her last period), the number of “post-term” pregnancies decreased from 10.3% to 2.7% (Taipale & Hiilesmaa 2001).
Is it safe to date your pregnancy with an ultrasound?
Ultrasound uses sound waves to create an image of what is happening on the inside of the body. The image created by ultrasound is called a sonogram, a “sound picture.” Obstetric ultrasound can provide information about the fetus and its organs, as well as the uterus, the placenta, and other body structures (WHO 2022).
There are many reasons why ultrasounds are recommended during pregnancy. They can provide an estimate of gestational age, identify life-threatening conditions (like placenta previa or placenta accreta), detect differences of development in the fetus that help families make informed medical decisions, provide reassurance to parents who have experienced pregnancy loss, facilitate bonding, and attempt to estimate fetal size.
Some prefer not to have an ultrasound during pregnancy. There are a variety of reasons why this might be the case. Some parents believe that an ultrasound is unnecessary if they are unwilling to terminate a pregnancy for any reason at all. Others believe that ultrasounds have no value as a tool for monitoring a pregnancy’s progression or diagnosing problems. A few believe that ultrasounds are harmful to the pregnant person or the fetus because of the soundwaves used to generate the sonogram.
Parents may be reassured to know that research has not identified any health risks of using standard ultrasound waves (using the ALARA principle, see below) during prenatal care (AIUM 2023a). However, it is impossible to prove the complete absence of risk, and soundwaves used in ultrasound scans are a form of energy that can generate heat as well as have a physical effect on tissues. To understand this, it might help to think about how extremely loud sounds can cause speakers to rattle, or how a softer sound can make you feel a gentle vibration in your body (Miller et al. 2020). Because of the potential to effect tissues, ultrasound professionals limit a patient’s exposure to soundwaves by adhering to a standard known as ALARA, or “As Low As Reasonably Achievable.” (Miller et al. 2020). The ALARA standard includes strict soundwave and time limits. The ultrasound technician should use the lowest intensity of soundwaves for the least amount of time to get a useful picture (AIUM 2023b; Miller et al. 2020).
The ALARA principle is also why professional bodies recommend against “keepsake” ultrasounds. While expectant parents are understandably eager to see what their baby looks like, if there is no medical need for an ultrasound, then it is recommended not to have one (ACOG 2017, Reaffirmed 2021; AIUM 2019, Revised 2024).
The evidence on ultrasound during pregnancy demonstrates that ultrasounds during pregnancy are widely accepted to be safe and can be useful not only for dating a pregnancy but identifying potential health issues that could affect the pregnant person or baby (AIUM 2023a). However, professional guidelines in the U.S. recognize that a pregnant person can refuse recommended care, even if that puts themselves or their fetus at risk (ACOG 2016, reaffirmed 2019).
Why is LMP less accurate than using ultrasound?
There are several reasons why the LMP is usually less accurate than an ultrasound (COG 2017, reaffirmed 2025; Jukic et al., 2013; Lawson et al. 2021; Savitz et al., 2002). LMP is less accurate because it can have these problems:
- Menstrual cycles can be irregular, or not 28 days.
- Factors other than the date of conception could influence the length of a pregnancy.
- The date of the LMP might be uncertain.
- Ovulation does not always occur on the 14th day of a cycle.
- An embryo may take longer to implant in the uterus in some situations.
- Research indicates that some people are more likely to recall a date that includes the number 5, or even numbers, so they may inaccurately recall that the first day of their LMP has one of these numbers in it.
What is the best time to have an ultrasound to determine gestational age?
In one high-quality study, researchers grouped ultrasound scans by <7 weeks, 7-10 weeks, 11-14 weeks, 14-19 weeks, and 20-27 weeks (Khambalia et al. 2013).
The authors found that the most accurate time to perform an ultrasound to determine the gestational age was 11-14 weeks. About 68% of people gave birth ±11 days of their estimated due date as calculated by ultrasound at 11-14 weeks. This was a more accurate result than any of the other ultrasound scans, and more accurate than the LMP.
The accuracy of the ultrasound saw a significant decline starting at about 20 weeks. Using an estimated due date from either the LMP or an ultrasound at 20-27 weeks led to a higher rate of pre- and post-term births.
Most guidelines today recommend an 11 to 14 week dating ultrasound as the best practice for dating a pregnancy (ACOG 2014, reaffirmed 2025; Butt & Lim 2019; Morgan & Cooper 2022; NICE 2021).
Should a due date be changed based on a third trimester ultrasound?
At EBB we sometimes hear from parents and birth workers about late-in-pregnancy ultrasounds that are sometimes used to change a person’s EDD. But what is the evidence on this practice? And how common is it?
In the Listening to Mothers III study, one in four mothers (26%) reported that their care provider changed their estimated due date based on a late pregnancy ultrasound. For 66% of the mothers, the estimated due date was moved up to an earlier date, while for 34% of the mothers, the date was moved back to a later date (Declercq et al. 2013). While this statistic comes from older data, we continue to read anecdotes on social media about families who are experiencing due date changes in late pregnancy.
Ultrasounds in the third trimester are less accurate than earlier ultrasounds or the LMP at predicting gestational age (Morgan & Cooper 2022). Ultrasounds in the third trimester are not as accurate because they are measuring the size of the baby and comparing him or her to a “standard” sized baby. All babies are about the same size in early pregnancy. But if your baby will be larger than average, they could be perceived as being older than they actually are when the ultrasound is done, in which case your due date could be moved up incorrectly.
The reverse is also true for babies that will be smaller than average at term—their due date might be moved to a later date. This could be risky if the baby is experiencing growth restriction, as growth-restricted babies have a higher risk of stillbirth towards the end of pregnancy (see our discussion of stillbirth later in this article for more details).
Because of these problems with third trimester ultrasounds, the American College of Obstetricians and Gynecologists states that due dates should only be changed in the third trimester in very rare circumstances (2017, reaffirmed 2025). They suggest that the due date should only be changed after a third trimester pregnancy ultrasound if 1) it is the pregnant person’s first ultrasound, and 2) it is more than 21 days different than the due date suggested by the LMP (ACOG 2017, reaffirmed 2025).
While the first trimester ultrasound to determine gestational age is the most accurate means of estimating gestational age, not everyone can access obstetric care right away. Some people may rely on a third trimester scan to estimate how far along they are in their pregnancy (Khalil et al. 2024; Papageorghiou et al. 2016). While the third trimester scan is not very accurate, researchers are working to improve the accuracy of these scans (Self et al. 2022)
How long is a normal pregnancy? Is it really 40 weeks?
In the U.S. and other Western countries, induction is common at or even before 40 weeks, so it is impossible to know exactly what percentage of people today would naturally go into labor and give birth before, on, or after their estimated due date. See the link to our Signature Article on the ARRIVE trial at the end of this article to learn more about why elective inductions before 40 weeks have become more common.
In the past, researchers figured out the average length of a normal pregnancy by looking at a group of people and measuring the time from ovulation (or the last menstrual period, or a pregnancy dating ultrasound) until the date of birth—and calculating the average number of weeks and days. However, this method is wrong and does not give us accurate results, because so many people are induced when they reach 39, 40, 41, or 42 weeks.
If you do include people who are induced in your average, then you are including people who gave birth earlier than they would have otherwise. With an induction they are not given time to go into labor on their own.
But this puts researchers in a bind, because if you exclude someone who was induced at 42 weeks from your study, then you are ignoring a pregnancy that was induced because it went longer—and by excluding that case, you artificially make the average length of pregnancy too short.
To deal with this problem, researchers use a method called “survival analysis” or “time to event analysis.” This is a special method that allows you to include all of these people in your study and still get an accurate picture of how long it takes the average person to go into spontaneous labor.
There have been two studies that measured the average length of pregnancy using survival analysis. Smith (2001a) and Jukic et al. (2013) are older studies but remain relevant today because they contain some of the most important data ever collected on pregnancy length.
Study finds that estimated due date is 3 to 5 days AFTER 40 weeks
In an important study published in 2001, Smith looked at the length of pregnancy in 1,514 healthy women whose estimated due dates, as calculated by the first day of the last menstrual period, were perfect matches with estimated due dates from their first trimester ultrasound (Smith 2001a).
The researchers found that 50% of all women giving birth for the first time gave birth by 40 weeks and 5 days, while 75% gave birth by 41 weeks and 2 days.
Meanwhile, 50% of all women who had given birth at least once before gave birth by 40 weeks and 3 days, while 75% gave birth by 41 weeks.
This means that for both first-time and experienced mothers in Smith’s study, the traditional “estimated due date” of exactly 40 weeks and 0 days was wrong!
The actual pregnancy was, on average, about 5 days longer than the traditional due date (using Naegele’s rule) in a first-time mother, and 3 days longer than the traditional due date in a mother who has given birth before.
Study finds that estimated due date should be closer to 40 weeks and 5 days
In 2013, Jukic et al. used survival analysis to look at the normal length of a pregnancy. This was a smaller study—there were only 125 healthy women, and they all gave birth between the years 1982 and 1985. However, this was also an important study, because researchers followed the participants starting before conception and measured their hormones daily for six months (Jukic et al. 2013).
This means that the researchers knew the exact days that the participants ovulated, conceived, and even when each pregnancy implanted in the uterus!
So, what was the average length of a pregnancy in this study?
After excluding women who had preterm births or pregnancy-related medical conditions, the final sample of 113 women had a median time from ovulation to birth of 268 days (38 weeks, 2 days after ovulation).
The median time from the first day of the last menstrual period to birth was 285 days (or 40 weeks, 5 days after the last menstrual period).
The length of pregnancy ranged from 36 weeks and 6 days to one person who gave birth 45 weeks and 6 days after the last menstrual period. The 45 weeks and 6 days sounds really long… but this particular person actually gave birth 40 weeks and 4 days after ovulation. Her ovulation did not fit the normal pattern, so we know her LMP due date was not accurate.
The researchers also found that:
- 10% gave birth by 38 weeks and 5 days after the LMP.
- 25% gave birth by 39 weeks and 5 days after the LMP.
- 50% gave birth by 40 weeks and 5 days after the LMP.
- 75% gave birth by 41 weeks and 2 days after the LMP.
- 90% gave birth by 44 weeks and zero days after the LMP.
Remember though, some of the participants did not ovulate on the 14th day of their period (that’s why you saw the statistic that 10% still haven’t given birth by 44 weeks after the LMP!) So, if we look at when people give birth after ovulation, you’ll see this pattern:
- 10% gave birth by 36 weeks and 4 days after ovulation.
- 25% gave birth by 37 weeks and 3 days after ovulation.
- 50% gave birth by 38 weeks and 2 days after ovulation.
- 75% gave birth by 39 weeks and 2 days after ovulation.
- 90% gave birth by 40 weeks and zero days after ovulation.
Women who had embryos that took longer to implant were more likely to have longer pregnancies. Also, those who had a specific sort of hormonal reaction right after getting pregnant (a late rise in progesterone) had a pregnancy that was 12 days shorter, on average.
So, is the traditional “due date” really your due date?
Based on the best evidence, there is no such thing as an exact “due date,” and the standard estimated due date of 40 weeks from the first day of the LMP is not accurate. Instead, it would be more appropriate to say that there is a normal range of time in which most people give birth during the term period. About half will go into labor on their own by 40 weeks and 5 days (for first-time parents) or 40 weeks and 3 days (for parents who have given birth before). The other half will not.
Are there some things that can make your pregnancy longer?
By far, the most important predictor of a longer pregnancy is a family history of long pregnancies— including your own personal history, your mother and/or sisters’ history, and your baby’s biological father’s family history (Jukic et al. 2013; Mogren et al. 1999; Oberg et al. 2013; Olesen et al., 1999; Olesen et al. 2003).
In 2013, Oberg et al. published a large study that looked at more than 475,000 Swedish births, most of which were dated with an ultrasound before 20 weeks. They found that family history has an incredibly strong influence on your chance of having a birth after 42 weeks:
- If you’ve had a post-term birth before, you have 4.4 times the chance of having another post-term birth with the same partner.
- If you’ve had a post-term birth before, and then you switch partners, you have 3.4 times the chance of having another post-term birth with your new partner.
- If your sister had a post-term birth, you have 1.8 times the chance of having a post-term birth.
Overall, researchers found that half of your chance for having a post-term birth comes from genetics. This includes the baby’s genetic tendency to gestate longer (due to genes the baby inherited from both biological parents), and the gestational carrier’s genetic tendency to carry a pregnancy longer. The Swedish researchers even proposed that you could call some pregnancies “resistant,” because these parents and/or fetuses have a genetically increased resistance to going into labor earlier.
Since Oberg et al.’s 2013 study, a number of researchers have identified potential genes in babies and gestational parents that might determine pregnancy length (Liu et al. 2019; Schierding et al. 2018; Solé-Navais et al. 2023). Understanding the relationship between genetics and environment in how long a pregnancy lasts will help not only people who have very long pregnancies, but those at higher risk for pre-term labor as well.
Some other factors that increase the chances of a pregnancy lasting longer include:
- Higher body mass index before you get pregnant (Halloran et al. 2012; Jukic et al. 2013; Latif & Aiken 2021; Lauth et al. 2021; Oberg et al. 2013).
- Higher weight gain during pregnancy (Halloran et al. 2012; Latif & Aiken 2021).
- Longer time between when you ovulated and when your pregnancy implanted (Jukic et al. 2013).
- Older maternal age (Jukic et al. 2013; Oberg et al. 2013).
- Heavier birth weight of the mother (Jukic et al. 2013).
- Higher education level of the mother (Oberg et al. 2013).
- Being pregnant for the first time (Latif & Aiken 2021; Oberg et al. 2013; Norwitz 2025)
- Being pregnant with a male baby (Divon et al. 2002; Latif & Aiken 2021; Oberg et al. 2013).
- Baby’s maternal grandmother gave birth post-term (Mogren et al. 1999; Olesen et al. 1999; Olesen et al. 2003).
- Exposure to a stressful event (i.e. natural disaster, terrorist attack) late in pregnancy (Evans et al. 2022; Magerison-Zilko et al. 2015; Menclova & Stillman 2020).
- Some differences of fetal development (Latif & Aiken 2021).
- The baby is measuring small by ultrasound at 10–24 weeks (Johnsen et al. 2008).
- Experiencing environmental stress towards the end of pregnancy (at 33-36 weeks) (Margerison-Zilko et al. 2015).
However, in many cases it is impossible to predict who might have a shorter or longer pregnancy, and we might never fully understand why babies come when they do (Norwitz 2025).
What are the risks of going past your due date?
The risks of some complications goes up as you go past your due date. Some risks are serious but rare (including infection and placental abruption), while other risks (Cesarean, perineal tears, and forceps- or vacuum-assisted deliveries) are more common . You can review the exact statistics from some of important studies on this topic in Table 1 below.
Table 1: Risks Associated With Going Past the Due Date
| Study | Study Synopsis | Maternal Risks | Infant Risks |
|
|
|
|
| Caughey & Musci 2004 |
|
|
|
| Caughey et al. 2007 |
|
|
|
|
Lindegren et al. 2022
|
|
|
|
| Razaz et al. 2022 |
|
|
In addition to the information reported in these studies, other risks for post-term pregnancy include having low amniotic fluid, and something called dysmaturity syndrome (growth restriction plus muscle wasting), which happens in about 10% of babies who go past 42 weeks (Mannino 1988). It is also more common to see meconium-stained amniotic fluid the further you go past 40 weeks. For more information about meconium-stained amniotic fluid, read this article by Dr. Rachel Reed.
What about the risk of stillbirth?
Note from EBB: Stillbirth affects more than 1.9 million families around the globe each year (including 21,000 families in the U.S.). The impact of stillbirth ripples throughout entire communities but is rarely discussed openly. At EBB we remember the babies lost in stillbirth, honor their families, and aim to raise awareness and empowerment by sharing the latest in pregnancy and birth research.
Stillbirth occurs when a baby dies in utero after 20 weeks’ gestation (though in some parts of the world stillbirths are counted starting after 22 weeks’ gestation).
Every year an estimated 2 million stillbirths occur around the world (Hug et al. 2021). In the U.S., the stillbirth rate is 5.71 per 1000 births, or one out of every 175 pregnancies (CDC 2025). Stillbirths are rare, occurring at roughly the same rate as infant deaths in the first year of life (CDC 2025). However, even though they are rare, stillbirth and infant death are tragic outcomes for families who experience them.
We do not always know why stillbirths occur. However, there are a few risk factors associated with stillbirth that are important to know, especially related to the length of pregnancy. So, in this section, we will talk about how the risk of stillbirth increases towards the end of pregnancy.
What are the different ways to talk about risk?
When learning about stillbirth risk, it’s important to know there is a difference between absolute risk and relative risk.
Absolute risk is the actual risk of something happening to you.
For example, if the absolute risk of having a stillbirth at 41 weeks was 1.7 out of 1,000, then that means that 1.7 mothers out of 1,000 (or 17 out of 10,000) will experience a stillbirth.
Relative risk is the risk of something happening to you in comparison to somebody else. If someone said that the risk of having a stillbirth at 42 weeks compared to 41 weeks is 94% higher, then that sounds like a lot. But some people may consider the actual (or absolute) risk to still be low—3.2 per 1,000 vs. 1.7 per 1,000.
Yes—3.2 is about 94% higher than 1.7, if you do the math! So, while it is a true statement to say, “the risk of stillbirth increases by 94%,” it can be a little misleading if you are not looking at the actual numbers behind it.
How are stillbirth rates measured?
There are different ways of measuring stillbirth rates. Depending on how the stillbirth rate is calculated, you can end up with different rates using the same data.
Up until the 1980s, some researchers thought that the risk of stillbirth past 41-42 weeks was similar to the risk of stillbirth earlier in pregnancy. So, they did not think there was any increased risk of going past your due date.
However, in 1987, a researcher named Dr. Yudkin published a paper introducing a new way to measure stillbirth rates. Dr. Yudkin said that earlier researchers used the wrong math when they calculated stillbirth rates—they used the wrong denominator! (Yudkin et al. 1987).

Here’s why this formula is wrong: We don’t need to know how many stillbirths happen out of every 1,000 births at 41 weeks. Instead, we need to know how many stillbirths happen at 41 weeks compared to all pregnancies and births at 41 weeks. In other words, you have to include the healthy, living babies that have not been born yet in your denominator.
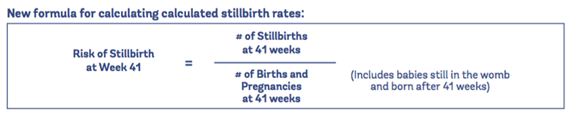
When researchers began using this new formula to figure out stillbirth rates, they found something very surprising—the risk of stillbirth decreased throughout pregnancy, until it reached a low point at 37-38 weeks, after which the risk started to rise again.
Even after researchers began using the new way of calculating stillbirth rates, there was still controversy about the best way to calculate this new formula for measuring stillbirth rates.
Different than what Yudkin proposed in 1987, some researchers preferred an “open-ended” stillbirth rate (also known as the “prospective risk of stillbirth”). An open-ended stillbirth rate at 40 weeks would tell us what a pregnant person’s risk of stillbirth was for any time after 40 weeks, if she let the pregnancy continue indefinitely.
Other researchers argued that most people (and doctors!) don’t want to know what the risk of stillbirth would be if a pregnant person chose to let the pregnancy continue on and on! (Hilder et al. 2000). They just want to know what the risk would be if they waited one more week until the next appointment, or even a few days.
But the “open-ended” stillbirth rate tells you what your risk of stillbirth at 40 weeks would be if you include babies born not just at 40 weeks, but 41 weeks, 42 weeks, 43 weeks, and on! (Boulvain et al. 2000).
In the end, you will find that stillbirth rates vary from study to study, depending on whether the researchers report the actual stillbirth rate, or the open-ended stillbirth rate.
The relationship between stillbirth rates and due dates
The risk of stillbirth decreases throughout pregnancy and then begins to increase sometime after 37-38 weeks. This finding has been confirmed many times by different researchers in different countries (Gregory et al. 2025; MacDorman et al. 2015; Rosenstein et al. 2012). However, the largest number of stillbirths still occur before 37 weeks’ gestation (Okwaraji et al. 2023). This phenomenon is called the “U-shaped curve” of stillbirth. In other words, there are higher rates of stillbirth earlier in pregnancy, then they go down until around 37-38 weeks, after which they rise again.
Because the risk of stillbirth rises at 40, 41, and 42 weeks, some researchers argue that although 40 weeks and 3-5 days may be the physiological length of pregnancy, 40 weeks may be the functional length of a pregnancy.
In other words, the average pregnancy normally lasts about 40 weeks and 5 days, but in some researchers’ opinion, because of the increased risk of stillbirth and newborn death; 40 weeks may be as long as a pregnancy should go. This concern was one of the major motivating factors behind the ARRIVE trial on 39-week elective induction, which has led to an increase in elective inductions at 39 weeks. [Note: Studies are ongoing, but researchers have not found that 39-week elective inductions lower the risk of stillbirth or infant death in low-risk pregnancies.]
And although the stillbirth statistics we discuss in this article show that stillbirth is somewhat rare, if you happen to be a parent who experiences the 1 in 315 stillbirths at 42 weeks (Muglu et al. 2019), then the risk doesn’t seem so low anymore.
So, what is the risk of stillbirth as you go past your due date?
Several large studies have been published about the risk of stillbirth during each week of pregnancy. Different researchers calculate the stillbirth rates using different statistical methods. However, all of the researchers found a relative increase in the risk of stillbirth as pregnancy advances towards late-term and post-term.
To get an accurate picture of stillbirth in people who go past their due date, it would be best to look at studies that took place in more recent times. In Table 2 (see below) we’ve chosen four of the largest studies to show you from Norway, Germany, and the U.S. Three studies used ultrasound to calculate gestational age, and one study used the LMP (Hamilton et al. 2024; Morken et al. 2014; Rosenstein et al. 2012; Weiss et al. 2014).
Table 2: Overview of Recent Large Studies on Stillbirth After the Due Date
| Author | Sample | Findings |
| Morken (2014) |
|
WhenMorken, et al. only looked atstillbirth rates from the years 1999 to2006 (when ultrasound was used to determine gestational age), they found that the stillbirth rates for infants who were not small for gestational age were: 37 weeks = 0.14 per 1,000 Babies who were small for gestational age had much higher stillbirth rates: |
| Weiss (2014) |
|
The stillbirth rates in this study were: 37.0-37.6 days = 2.77 per 1,000 38.0-38.6 days = 1.09 per 1,000 39.0-39.6 days = 0.90 per 1,000 40.0-40.6 days = 0.72 per 1,000 41.0-41.6 days = 0.44 per 1,000 42.0-42.6 days = 0.70 per 1,000 >42.6 days = 8.85 per 1,000 (2 babies stillborn out of 226 pregnancies)The authors note that the stillbirth rates they observed at 41 and 42 weeks were much lower than what has been observed in other studies—probably because their study is more recent(2004-2009 vs. 1980s-1990s). They also think that perhaps their fetal monitoring policy could be r |
| Rosenstein (2012) |
|
The stillbirth rates were: 37 weeks = 0.21 per 1,000 The authors also looked at the combined risk of the baby either being still born or dying in the first year of life if the mother waited one more week to give birth (combined stillbirth + infant death risk): 37 weeks = 1.26 per 1,000 |
| Hamilton et al. 2023 |
|
For infants conceived with any type of infertility treatment (fertility enhancing drugs, IUI, and assisted reproductive technologies) the open-ended stillbirth rates were: 37 weeks = 3.1 per 10,000 For infants conceived only using assisted reproductive technologies (IVF, gamete or zygote transfer) 37 weeks = 2.5 per 10,000
|
Large meta-analysis of stillbirth data from four countries finds that absolute stillbirth risk begins to rise at 41 weeks’ gestation
One of the largest meta-analyses on the risks of stillbirth and newborn death at each week of term pregnancies was published in 2019 (Muglu et al.). A meta-analysis is when researchers combine data from multiple studies into one big “meta” study. The researchers included 13 studies (15 million pregnancies, with nearly 18,000 stillbirths). All of the studies were carried out in four countries defined as “high-income” by the World Bank (Denmark, Norway, U.K., and the U.S.).
In the study the researchers stratified the risk of stillbirth based on gestational week:
- 37 weeks = 0.11 per 1000
- 38 weeks = 0.16 per 1000
- 39 weeks = 0.42 per 1000
- 40 weeks = 0.69 per 1000
- 41 weeks = 1.66 per 1000
- 42 weeks = 3.18 per 1000
Based on their data, Muglu et al. (2019) calculated the “number needed to harm” with waiting for labor to begin on its own. This number tells you how many people would need to wait for labor for one more week in order to experience one additional stillbirth. To experience one additional stillbirth, there would need to be at least 2,367 people waiting for labor for one more week starting at 39 weeks. At 40 weeks, 1,449 people would have to wait for labor for one more week to experience one additional stillbirth. At 41 and 42 weeks, only 604 and 315 people, respectively, would have to wait for labor for one more week to experience one additional stillbirth.
The researchers also found evidence that health care systems are failing Black mothers and babies—an alarming but common theme in health care research. Black mothers were 1.5 to 2 times more likely than white mothers to have a stillbirth at every week of pregnancy.
When they looked only at low-risk pregnancies, the risk of stillbirth was:
- 38 weeks = 0.12 per 1000
- 39 weeks = 0.14 per 1000
- 40 weeks = 0.33 per 1000
- 41 weeks = 0.80 per 1000
- 42 weeks = 0.88 per 1000
Low-risk pregnancy was defined as pregnancies with a single baby, no congenital differences of development, and no pregnancy complications.
There was no additional risk of newborn death when giving birth between 38 and 41 weeks, but the risk of newborn death did increase beyond 41 weeks.
So, although most researchers have found an increase in stillbirth rates in the late term and post term period, some might consider the “absolute” increase in risk to be small until 41 weeks, after which it reaches about 0.80-1.66 out of 1,000. However, the chance of stillbirth can be increased by other risk factors for stillbirth (see below).
What are other factors that increase the risk of stillbirth?
While we do not always know why a stillbirth occurs, there are some known fetal, maternal, and placental risk factors for stillbirth (Duryea 2018). These factors do not necessarily cause stillbirth but may increase the risk of stillbirth. Of course, parents can still experience the stillbirth of a child even when none of these risk factors are present. As many as one-third of all stillbirths that take place before labor have no known cause (Warland & Mitchell 2014). To read more about theories of unexplained stillbirth, read this article here.
Fetal risk factors
Fetal risk factors for stillbirth include:
- Congenital abnormalities (Lawn et al. 2016)
- Male sex (Gregory et al. 2025; Lawn et al. 2016; Mondal et al. 2014)
- Rh incompatibility between fetus and pregnant parent (Lawn et al. 2016)
- To learn more about Rh incompatibility, listen to EBB Podcast Episode 329
- Post-term pregnancy (Lawn et al. 2016)
- Small for gestational age (Lawn et al. 2016)
Small for gestational age is one of the most important risk factors for stillbirth
Babies that are smaller than expected are sometimes referred to as being small for gestational age (SGA) at birth or having fetal growth restriction in utero. Fetal growth restriction (FGR) is sometimes referred to as intrauterine growth restriction (IUGR).
In the U.S., SGA is when a baby has a birth weight that is less than the 10th percentile for gestational age at birth (ACOG 2021; Chew et al. 2024). Meanwhile, FGR refers to fetuses that have an estimated fetal weight or abdominal circumference that is less than the 10th percentile for their gestational age (ACOG 2021). These two terms—SGA and FGR—are sometimes used interchangeably by researchers and professional groups (Chew et al. 2024; Melamed et al. 2021). Adding to the confusion, other professional groups define FGR using a cut off of 3rd percentile (rather than 10 percentile) in weight and abdominal circumference (Chew et al. 2024; Melamed et al. 2021).
When a baby is small, this does not necessarily mean that anything is automatically wrong. Some healthy babies are just smaller sized than others, which is sometimes referred to as being constitutionally small and healthy (Melamed et al. 2021). For example, you might expect short statured parents to sometimes give birth to a smaller baby.
However, sometimes a baby being very small means that something has gone wrong. This could be because they have an underlying genetic condition, or there is another problem in pregnancy that could negatively impact their growth (which we discuss below).
Another problem that smaller fetuses face is that size is used to estimate gestational age. This is not a problem early in pregnancy, when all embryos are roughly the same size. But if the due date is changed towards the end of pregnancy because the baby “measures small,” then a care provider may underestimate the baby’s gestational age. In other words, a baby with a health problem who is growth-restricted might be more post-term than the health team realizes they are. Some small babies are at increased for stillbirth, and if providers and parents are unaware of the true gestational age, then this can increase the risk of stillbirth even further (Morken et al. 2014). That’s because post-term babies who are small for gestational age (body weight below the 10th percentile) have a 6-7 times higher chance of stillbirth and newborn death than post-term babies who are not small for gestational age (Morken et al. 2014).
In a recent study looking at the relationship between stillbirth, gestational age, and size for gestational age, researchers reviewed data from over 125 million births and 635,107 stillbirths. The babies in this study were born between 22 weeks’ gestation to 44 weeks 6 days gestation across 13 different countries during the years 2000 to 2020 (Okwaraji et al. 2023). The researchers used SGA to refer to weight at birth, and they used six categories to classify all births:
- Pre-term and small for gestational age (below the 10th percentile): PreT + SGA
- Pre-term and appropriate for gestational age: PreT + AGA
- Pre-term and large for gestational age (above the 90th percentile): PreT + LGA
- Term and small for gestational age: T + SGA
- Term and appropriate for gestational age: T + AGA
- Term and large for gestational age: T+ LGA
The results showed that most stillbirths occurred during the pre-term period (74.3%), and that being small for gestational age (whether pre-term or at term) increased the risk for stillbirth. While the risk of stillbirth was highest for PreT + SGA babies, the researchers found that T + SGA babies had a five-fold higher risk of stillbirth compared to babies that were term and an appropriate size for gestational age. The researchers estimated that 25% of all stillbirths, across all gestational ages, were related to being small for gestational age.
But why is a smaller size concerning, and why could it increase the risk of stillbirth? Well, when there is a growth restriction, this can signal that there might be a health problem with the pregnancy. And in many cases, if a fetus is FGR, then there may be an issue with the placenta (see below).
Serious placental problems are a risk factor for stillbirth
The placenta is a temporary organ that provides oxygen, fluids, and nourishment to the fetus during pregnancy via the umbilical cord. If a serious problem arises with the placenta, it can result in fetal demise, or a stillbirth.
Known placental problems associated with an increased risk of stillbirth include (Waller & Saade 2024):
- Placental abruption (a condition where the placenta separates from the uterus).
- Chorioangioma (a non-cancerous tumor of the placenta).
- Vasa previa (when unprotected fetal blood vessels cross over on or near the opening of the uterus).
- Umbilical cord abnormalities.
As we reviewed in the previous section, small size of the baby is a known risk factor for pre-term stillbirth and term stillbirth. Placental problems early in pregnancy that interfere with the organ’s ability to nourish a fetus can cause stunted growth, resulting in small size and a higher risk for stillbirth.
But in many term stillbirths, the baby is not small for gestational age. In these cases, researchers hypothesize that placental problems can cause stillbirth as the oxygen demands of the fetus become more substantial at term. In these cases, the placental problems were not serious enough earlier in pregnancy to impact the growth of the fetus but became problematic later on as oxygen demands increased (Coutinho et al. 2020).
However, we still don’t know for sure why some babies experience stillbirth, even when they are small-for-gestational age. That’s because in up to 25% of cases where a fetus is small or growth restricted, there are no clear signs of damage or deformity in the placenta (Paules et al. 2019). We need a lot more research on the placenta, especially on problems that do not present as an issue of placental size, structure, location, or connection to the uterus. We especially need more research to learn how to identify problems with placental function, so that stillbirths and other complications can be prevented.
Can an “aging placenta” increase the risk of stillbirth?
Some providers state that the “aging of the placenta” is a potential cause of late-term or post-term stillbirths. In 2017, researchers published the first study looking at biological markers of placental aging. In this study, researchers in Australia collected placentas from 34 people who gave birth between 37-39 weeks of pregnancy, 28 people who gave birth between 41-42 weeks, and 4 people who experienced stillbirths between 32-41 weeks (Maiti et al. 2017). Although this was a small study (as is common with biological tissue studies), it can provide info to guide future research.
The researchers removed five or more tissue samples from each placenta, then analyzed the samples using a variety of biochemical tests. For example, one of the tests looked for a marker of DNA/RNA damage that was previously observed in other aging tissues, such as the brain in Alzheimer’s disease. They found a significant increase in DNA/RNA damage in late-term and stillbirth placentas compared to the placentas from 37-39 weeks.
Overall, the analysis of the placentas from the 41–42-week pregnancies and from the stillbirths showed increased signs of aging. These placentas had a decreased ability to transport nutrients to the baby and waste products away from the baby, compared to the placentas from the earlier term births. The rate of placental aging varied in different pregnancies, and the authors stated that not all of the 41–42-week placentas showed signs of aging. We reached out to the authors to find out more, and they told us that one-third of the 41-42-week placentas showed increased signs of aging compared to the 37-39-week placentas. This means that two-thirds of the 41–42-week placentas did not show signs of aging.
Interestingly, the authors say that in the future it may be possible to predict which babies are at increased risk of stillbirth by measuring markers of placental aging in the mother’s blood. You can watch a 10-minute video describing the findings of their research here.
In a 2019 study on placental aging, researchers in Spain examined placentas to explore the connection between fetal size and the condition of the placenta (Paules et al. 2019). They compared the placentas of 21 babies born at term (after 37 weeks) who were typical in size for gestational age with those of 18 babies born at term who were between the 3rd and 9th percentiles (classified as small for gestational age, or SGA) and another babies born at term who were less than 3rd percentile in weight (classified as fetal growth restricted or FGR) (Paules et al. 2019). In this study the researchers found that the placentas of the SGA babies and the FGR babies showed the same signs of premature aging. The researchers hypothesize that this early aging reduces the ability of the placenta to function normally, resulting in babies who are unusually small.
Maternal risk factors for stillbirth
Certain risk factors related to pregnancy, often referred to as maternal characteristics, can also be related to an increased risk of stillbirth. These include:
- Being pregnant with your first baby (Flenady et al. 2011; Huang et al. 2000; Smith 2001b; Stillbirth Collaborative 2011).
- Fewer than four prenatal visits or no prenatal care (Flenady et al. 2011; Huang et al. 2000).
- Low socioeconomic status (Flenady et al. 2011; Huang et al. 2000).
- A body mass index (BMI) over 25 to 30 (Flenady et al. 2011; Huang et al. 2000; Stillbirth Collaborative 2011).
- Smoking (Flenady et al. 2011; Gill et al. 2025; Gregory et al. 2025; Morken et al. 2014).
- Pre-existing diabetes (Flenady et al. 2011; Gill et al. 2025; Stillbirth Collaborative 2011).
- Pre-existing hypertension (ACOG 2020, Reaffirmed 2025; Flenady et al. 2011; Gill et al. 2025).
- Young maternal age (less than 18) and older maternal age (≥40 years) (Stillbirth Collaborative 2011; Gill et al. 2025).
- Not living with a partner (Stillbirth Collaborative 2011).
- History of previous stillbirth (ACOG 2020, Reaffirmed 2025; Stillbirth Collaborative 2011).
- Being pregnant with multiples (Gregory et al. 2025; Stillbirth Collaborative 2011).
Impact of racism on the risk of stillbirth
Another important risk factor for stillbirth involves experiencing discrimination or racism during pregnancy. Racism has been shown to have harmful effects on the health, safety, and wellbeing of pregnant people and babies. Researchers have observed that Black, Indigenous, and other people of color are subjected to individual, institutional, and other forms of racism throughout their lives; these experiences build on each other and are uniquely stressful, and the increased stress can negatively impact pregnancy outcomes (Giscombé and Lobel 2005).
The most recent stillbirth data for the U.S. demonstrates an overall stillbirth rate of 5.53 stillbirths per 1,000 pregnancies. However, when looking across racial and ethnic groups, rates vary significantly (Gregory et al. 2025):
- American Indian and Alaska Native: 6.87 per 1,000
- Asian: 4.14 per 1,000
- Black: 9.95 per 1,000
- Native Hawaiian or other Pacific Islander: 10.18 per 1,000
- White: 4.55 per 1,000
- Hispanic: 4.76 per 1,000
The risk of stillbirth does not have to do with the color of someone’s skin. Instead, experts in racial health disparities, such as Dr. Joia Crear-Perry, OB-GYN, Founder of the National Black Equity Collaborative, often clarify with the explanation:
“Race isn’t the risk factor – racism is.”
Anthropologist, professor, and doula Dána-Ain Davis developed the term obstetric racism to help explain the impact racism has on Black birthing people. Davis (2019) defines obstetric racism as:
“…a threat to maternal life and neonatal outcomes. It includes, but is not limited to, critical lapses in diagnosis; being neglectful, dismissive, or disrespectful; causing pain; and engaging in medical abuse through coercion to perform procedures or performing procedures without consent. … Obstetric racism emerges specifically in reproductive care and places Black women and their infants at risk.”
Experiences of racism throughout life can result in increased stress and harms to overall health and wellbeing. When this stress is combined with the immediate threats posed by obstetric racism, Black and Indigenous birthing people face up to two times the risk of stillbirth compared to white birthing people U.S. In Debbink et al.’s review of the racial and ethnic inequities in stillbirth in the U.S., community engagement with and the prioritization of experiential wisdom from communities of color are described as necessary tools for addressing this serious health inequality (Debbink et al. 2024).
You can learn more about racism and anti-racism in birth care and birth work by visiting our Signature Article, Evidence on: Antiracism in Health Care and Birth Work.
Can stillbirths be prevented?
While many risk factors for stillbirth involve aspects of identity or pregnancy that one does not have control over, there are some things that pregnant people can do to lower their risk of stillbirth. Some of the work to lower the risk for everyone must involve addressing structural inequalities that worsen the risk of stillbirth for pregnant people of color as well as for pregnant people who lack access to adequate prenatal care.
Other steps individuals can take to potentially reduce the risk of stillbirth include:
- Not smoking or consuming other drugs during pregnancy (Atkins et al. 2023).
- Accessing prenatal care regularly during pregnancy, including screening for conditions like gestational diabetes and pre-eclampsia (Atkins et al. 2023).
- Seeking midwifery care (Ota et al. 2020).
- Safe sleep positioning (sleeping on one’s side rather than on their back) (Atkins et al. 2023).
There is mixed evidence of the effectiveness of fetal movement tracking for preventing stillbirth. The goal of tracking fetal movement is to help pregnant people to be aware of their baby’s movements so that if they notice a decrease in the typical movement pattern that they will be able to seek additional testing (non-stress testing, biophysical profile, ultrasound) to determine whether or not additional interventions are needed.
A 2009 study in Norway of 14 medical centers investigated the effectiveness of a program to raise awareness of decreased fetal movements among pregnant people and providers (Tveit et al. 2009). The study followed over 65,000 pregnant people over a two-year span before the program was initiated, and then while the program was in place. The program trained providers to evaluate pregnant people who presented at the hospital with decreased fetal movements. They also taught pregnant people to track routine fetal movements by “counting the kicks” with a chart, and they guided pregnant people to seek care quickly if they noticed a decline in fetal movements. Tveit et al. found that there was a significant decrease in stillbirths during the intervention, falling from 3 per 1,000 births to 2 per 1,000 births.
A 2015 Cochrane Review of fetal movement counting for assessment of fetal wellbeing reviewed five studies that enrolled over 70,000 pregnant women (Mangesi et al. 2015). The researchers found that the evidence for the effectiveness of programs to track fetal movements was inconclusive. Some studies showed that these programs reduced stillbirths, while others did not indicate a difference in fetal outcomes after implementation.
A 2022 study investigated the effectiveness of a similar reduced fetal movements program for providers and birthing people in 33 hospitals in the UK and Ireland (Camacho et al. 2022). Hospitals participating in the study were randomized to 9 different program implementation dates between 2014 to 2016, and data was collected from 409,275 pregnancies. The researchers found that there was no reduction in stillbirths associated with the implementation of the fetal movement awareness program (Camacho et al. 2022).
The evidence on the effectiveness of programs to track fetal movements to prevent stillbirth is unclear. However, it’s important that if a pregnant person feels that something is wrong, or if they notice a difference in fetal activity, then they should contact their provider or go to the labor and delivery ward for testing.
To learn more about kick-counting, visit our podcast episode with a representative of Count the Kicks organization, and check out the free Count the Kicks app.
What is the evidence on being induced electively to lower the risk of stillbirth?
We have two Signature Articles for you to learn more! Check out the companion Signature Article, “Evidence on: The ARRIVE Trial and 39-Week Elective Induction” here, and “Evidence on: Inducing at 41 Weeks or Later” here. In both of those articles, we provide more information about the pros and cons of induction versus waiting for labor to start on its own.
What’s the bottom line?
The traditional way of calculating the estimated due date (40 weeks after the last menstrual period) is not evidence-based. Instead, it is more accurate to give people a range of time that they will probably give birth:
About half of first-time mothers will give birth by 40 weeks and 5 days after the first day of their last menstrual period, with the other half giving birth after that time point
-
- About half of mothers who have given birth before will give birth by 40 weeks and 3 days after the first day of their last menstrual period, with the other half giving birth after that
An ultrasound before 20 weeks is usually more accurate than using the last menstrual period, and the accuracy of an ultrasound is highest if it is done between 11 and 14 weeks. The estimated due date can also be calculated with the ovulation day (which is known with in vitro fertilization and fertility tracking). This is more accurate than using the last menstrual period because it no longer assumes a Day 14 ovulation. Because of the risks of inaccurately dating a small baby, changes to the due date in late pregnancy should only be made in rare circumstances.
A large body of evidence shows that there is an increase in the risk of stillbirth at the end of pregnancy, although some might consider the “absolute” increase in risk to be small until 41 weeks. Certain characteristics of a pregnancy, such as a first pregnancy or a pregnancy where the baby is small for their gestational age, can pose a higher risk for experiencing stillbirth in late pregnancy than other individuals. And although we need more research on prevention stillbirth, there are some actions pregnant families can take to help lower the risk of stillbirth, including screening for high blood pressure and gestational diabetes and seeking midwifery care.


Acknowledgment
I would like to extend my deepest gratitude to Sonja Billes, PhD and Robert Modugno, MD, MBA, FACOG, who traveled to Lexington, Kentucky in 2014 to help me conduct the literature search for the first draft of this article.
I would also like to thank my expert reviewers for an earlier version of this article—Shannon J. Voogt, MD, Board-Certified in Family Medicine; Tara Elrod, CDM; Heather Thompson, MS, PhD, Deputy Director of Elephant Circle; Mimi Bhatt (Niles), CNM, MSN, MPH, PhD; and Cynthia B. Flynn, CNM, PhD, FACNM, Past President of the American Association of Birth Centers, expert midwife at www.pregnancy.org and founder of Birth Center Consulting.
I would also like to thank Cristen Pascucci and Sharon Muza CD(DONA), BDT(DONA), LCCE, FACCE for their medical editing assistance in 2015, and Anna Bertone MPH for her contributions to the 2019 version of this article.
Resources
Signature Articles on Related Topics:
- Evidence on: The ARRIVE Trial and Elective Induction at 39 Weeks
- Evidence on: Inducing for Due Dates
Stillbirth Prevention Organizations
References:
- American College of Obstetricians and Gynecologists (ACOG). (2013, Reaffirmed 2025). “Committee opinion No. 579: Definition of Term Pregnancy.” Obstet Gynecol 122 (5): 1139–1140.
- (2014, Reaffirmed 2024). “Committee opinion No. 146: Management of Late-Term and Post-Term Pregnancies.” Obstet Gynecol 124 (2 pt. 1): 390–396.
- (2017, Reaffirmed 2021). “Committee Opinion No. 723: Guidelines for Diagnostic Imaging During Pregnancy and Lactation.” Obstet Gynecol 130(4): e210–e216.
- (2017, Reaffirmed 2025). “Committee Opinion No. 700: Methods for Estimating the Due Date.” Obstet Gynecol 129(5): e150–154.
- (2020, Reaffirmed 2025). “Obstetric Care Consensus #10: Management of Stillbirth: (Replaces Practice Bulletin Number 102, March 2009).” Am J Obstet Gynecol 222(3): B2-B20.
- (2021). “Fetal Growth Restriction: ACOG Practice Bulletin No. 227.” Obstet Gynecol 137(2): e16–e28.
- American Institute of Ultrasound in Medicine (AIUM). (2019, revised 2024). “Prudent Clinical Use and Safety of Diagnostic Ultrasound.” AIUM.org. Accessed November 7, 2025.
- (2023a). “AIUM Official Statement: Conclusions Regarding Epidemiology for Obstetric Ultrasound.” J Ultrasound Med 42(7): E11.
- AIUM (2023b). “AIUM Official Statement for Recommended Maximum Scanning Times for Displayed Thermal Index Values.” J Ultrasound Med 42(12): E74–E75.
- Ananth, C. V., Liu, S., Joseph, K.S., et al. (2009). “A comparison of foetal and infant mortality in the United States and Canada.” Int J Epidemiol 38(2): 480–489.
- Andersson, C. B., Petersen, J. P., Johnsen, S. P., et al. (2022). “Risk of complications in the late vs early days of the 42nd week of pregnancy: A nationwide cohort study.” Acta Obstet Gynecol Scand 101(2): 200–211.
- Atkins, B., Kindinger, L., Mahindra, M. P., et al. (2023). “Stillbirth: Prevention and supportive bereavement care.” BMJ Med 2(1): e000262.
- Baskett, T. F. & Nagele, F. (2000). “Naegele’s rule: a reappraisal.” BJOG 107(11): 1433–1435.
- Boulvain, M., Faltin, D., Ibecheole, V., et al. (2000). “Prospective risk of stillbirth. Randomised trials of earlier induction of labour are needed.” BMJ 320(7232): 445–446.
- Butt, K. & Lim, K. I. (2019). “Guideline No. 388-Determination of Gestational Age by Ultrasound.” J Obstet Gynaecol Can 41(10): 1497-1507.
- Camacho, E. M., Whyte, S., Stock, S. J., et al. (2022). “Awareness of fetal movements and care package to reduce fetal mortality (AFFIRM): A trial-based and model-based cost-effectiveness analysis from a stepped wedge, cluster-randomised trial.” BMC Pregnancy Childbirth 22(1): 235.
- Caughey, A. B. (2007). “Measuring perinatal complications: methodologic issues related to gestational age.” BMC Pregnancy Childbirth 7: 18.
- Caughey, A. B. & Musci, T. J. (2004). “Complications of term pregnancies beyond 37 weeks of gestation.” Obstet Gynecol 103(1): 57-62.
- Caughey, A. B., Stotland, N. E., & Escobar, G. J. (2003). “What is the best measure of maternal complications of term pregnancy: ongoing pregnancies or pregnancies delivered?” Am J Obstet Gynecol 189(4): 1047–1052.
- Centers for Disease Control (CDC). (2025). “Stillbirth: Data and Statistics.” Accessed November 9, 2025.
- Chew, L. C., Osuchukwu, O. O., Reed, D. J., et al. (2024). “Fetal Growth Restriction.” In: Treasure Island: StatPearls Publishing.
- Coutinho, C. M., Melchiorre, K., & Thilaganathan, B. (2020). “Stillbirth at term: Does size really matter?” Int J Gynaecol Obstet 150(3): 299-305.
- Davis, D. (2019). “Obstetric Racism: The Racial Politics of Pregnancy, Labor, and Birthing.” Med Anthropol 38(7): 560–573.
- Debbink, M. P., Stanhope, K. K., & Hogue, C. J. R. (2024). “Racial and ethnic inequities in stillbirth in the US: Looking upstream to close the gap: Seminars in Perinatology.” Semin Perinatol 48(1): 151865.
- Declercq, E. R., Sakala, C., Corry, M. P., et al. (2013). Listening to Mothers SM III: Pregnancy and Birth. New York: Childbirth Connection.
- Divon, M. Y., Ferber A., Nisell, H., et al. (2002). “Male gender predisposes to prolongation of pregnancy.” Am J Obstet Gynecol 187(4): 1081–1083.
- Drife, J. O. (2021). “The history of labour induction: How did we get here?” Best Pract Res Clin Obstet Gynaecol 77: 3–14.
- Duryea, E. 2018. “Stillbirth: What we know (and don’t know) about pregnancy loss.” UT Southwestern Medical Center MedBlog. Accessed November 11, 2025.
- Evans, J., Bansal, A., Schoenaker, D. A. J. M., et al. (2022). “Birth Outcomes, Health, and Health Care Needs of Childbearing Women following Wildfire Disasters: An Integrative, State-of-the-Science Review.” Environ Health Perspect 130(8): 86001.
- Flenady, V., Koopmans, L., Middleton, P., et al. (2011). “Major risk factors for stillbirth in high-income countries: A systematic review and meta-analysis.” Lancet 377(9774): 1331-1340.
- Gill, R., Weida, J., Mikes, B. A. (2025). “Stillbirth.” In: Treasure Island: StatPearls Publishing.
- Giscombe, C.L. & Lobel, M. (2005). “Explaining disproportionately high rates of adverse birth outcomes among African Americans: the impact of stress, racism, and related factors in pregnancy.” Psychol Bull 131(5): 662-83.
- Gregory, E. C. W, Valenzuela, C. P., Hoyert, D. L. (2025). “Fetal Mortality: United States, 2023.” Natl Vital Stat Rep 8: 1.
- Halloran, D. R., Cheng, Y. W., Wall, T.C., et al. (2012). “Effect of maternal weight on postterm delivery.” J Perinatol 32(2): 85-90.
- Hamilton, I., Martin, N., Liu, J., et al. (2023). “Gestational Age and Birth Outcomes in Term Singleton Pregnancies Conceived With Infertility Treatment.” JAMA Netw Open 6(8): e2328335.
- Hilder, L., Costeloe, K., & Thilaganathan, B. (1998). “Prolonged pregnancy: Evaluating gestation-specific risks of fetal and infant mortality.” Br J Obstet Gynaecol 105(2): 169-173.
- Hilder, L., Costeloe, K., & Thilaganathan, B. (2000). “Prospective risk of stillbirth. Study’s results are flawed by reliance on cumulative prospective risk.” BMJ 320(7232): 444-445; author reply 446.
- Huang, D. Y., Usher, R. H., Kramer, M. S., et al. (2000). “Determinants of unexplained antepartum fetal deaths.” Obstet Gynecol 95(2): 215-221.
- Hug, L., You, D., Blencowe, H., et al. (2021). “Global, regional, and national estimates and trends in stillbirths from 2000 to 2019: A systematic assessment.” Lancet 398(10302): 772–785.
- Johnsen, S. L., Wilsgaard, T., Rassmussen, S., et al. (2008). “Fetal size in the second trimester is associated with the duration of pregnancy, small fetuses having longer pregnancies.” BMC Pregnancy Childbirth 8: 25.
- Jukic, A. M., Baird, D. D., Weinberg, C. R., et al. (2013). “Length of human pregnancy and contributors to its natural variation.” Hum Reprod 28(10): 2848-2855.
- Khalil, A., Sotiriadis, A., D’Antonio, F., et al. (2024). “International Society of Ultrasound in Obstetrics and Gynecology Practice Guidelines: Performance of third-trimester obstetric ultrasound scan.” Ultrasound Obstet Gynecol 63(1): 131–147.
- Khambalia, A. Z., Roberts, C. L., Nguyen, M., et al. (2013). “Predicting date of birth and examining the best time to date a pregnancy.” Int J Gynaecol Obstet 123(2): 105-109.
- Kramer, M. S., Liu, S., Luo, Z., et al. (2002). “Analysis of perinatal mortality and its components: time for a change?” Am J Epidemiol 156(6): 493-497.
- Lawson, G. W. (2021). “Naegele’s rule and the length of pregnancy – A review.” Aust N Z J Obstet Gynaecol 61(2): 177–182.
- Latif, S. & Aiken, C. (2021). “Prolonged Pregnancy.” Obstetrics, Gynaecology & Reproductive Medicine 31(6): 170–174.
- Lauth, C., Huet, J., Dolley, P., et al. (2021). “Maternal obesity in prolonged pregnancy: Labor, mode of delivery, maternal and fetal outcomes.” J Gynecol Obstet Hum Reprod 50(1): 101909.
- Lawn, J. E., Blencowe, H., Waiswa, P., et al. (2016). “Stillbirths: Rates, risk factors, and acceleration towards 2030.” Lancet 387(10018): 587–603.
- Liu X, Helenius D, Skotte L, et al. (2019). “Variants in the fetal genome near pro-inflammatory cytokine genes on 2q13 associate with gestational duration.” Nat Commun 10(1): 3927.
- Loytved, C. A. & Fleming V. (2016). “Naegele’s rule revisited.” Sex Reprod Healthc 8: 100–101.
- MacDorman, M. F., Reddy, U. M., & Silver, R. M. (2015). “Trends in Stillbirth by Gestational Age in the United States, 2006-2012.” Obstet Gynecol 126(6): 1146–1150.
- Maiti, K., Sultana, Z., Aitken, R. J., et al. (2017). “Evidence that fetal death is associated with placental aging.” Am J Obstet Gynecol 217(4): 441.e1–442.e14.
- Mangesi, L., Hofmeyr, G. J., Smith, V., et al. (2015). “Fetal movement counting for assessment of fetal wellbeing.” Cochrane Database Syst Rev 10: CD004909.
- Mannino, F. (1988). “Neonatal complications of postterm gestation.” J Reprod Med 33(3): 271–276.
- Margerison-Zilko, C. E., Goodman, J. M., Anderson, E., et al. (2015). “Post-term birth as a response to environmental stress: The case of September 11, 2001.” Evol Med Public Health 2015(1): 13–20.
- Melamed, N., Baschat, A., Yinon, Y., et al. (2021). “FIGO (International Federation of Gynecology and Obstetrics) initiative on fetal growth: Best practice advice for screening, diagnosis, and management of fetal growth restriction.” Int J Gynaecol Obstet 152 Suppl 1(Suppl 1): 3 – 57.
- Menclova, A. K. & Stillman, S. (2020). “Maternal stress and birth outcomes: Evidence from an unexpected earthquake swarm.” Health Econ 29(12): 1705–1720.
- Miller, D. L., Abo, A., Abramowicz, J.S., et al. (2020). “Diagnostic Ultrasound Safety Review for Point-of-Care Ultrasound Practitioners.” J Ultrasound Med 39(6): 1069–1084.
- Mogren, I., Stenlund, H., & Högberg, U. (1999). “Recurrence of prolonged pregnancy.” Int J Epidemiol 28(2): 253-257.
- Mondal, D., Galloway, T. S., Bailey, T. C., et al. (2014). “Elevated risk of stillbirth in males: Systematic review and meta-analysis of more than 30 million births.” BMC Med 12: 220. https://pubmed.ncbi.nlm.nih.gov/25428603/
- Morgan, J. A. & Cooper, D. B. (2022). “Pregnancy Dating.” In StatPearls. Treasure Island: StatPearls Publishing. https://www.ncbi.nlm.nih.gov/books/NBK442018/
- Morken, N. H., Klungsoyr, K., & Skjaerven, R. (2014). “Perinatal mortality by gestational week and size at birth in singleton pregnancies at and beyond term: A nationwide population based cohort study.” BMC Pregnancy Childbirth 14: 172. https://pubmed.ncbi.nlm.nih.gov/24885576/
- Muglu, J., Rather, H., Arroyo-Manzano, D., et al. (2019). “Risks of stillbirth and neonatal death with advancing gestation at term: A systematic review and meta-analysis of cohort studies of 15 million pregnancies.” PLoS Med 16(7): e1002838. https://pubmed.ncbi.nlm.nih.gov/31265456/
- National Institute for Health and Care Excellence (NICE). (2021). “Antenatal Care: NICE guideline 201.” https://www.nice.org.uk/guidance/ng201/chapter/recommendations#routine-antenatal-clinical-care
- Norwitz, E. R. (2025). “Postterm pregnancy.” UpToDate.com, accessed September 24th, 2025. https://www.uptodate.com/contents/postterm-pregnancy
- Oberg, A. S., Frisell, T., Svensson, A., et al. (2013). “Maternal and fetal genetic contributions to postterm birth: Familial clustering in a population-based sample of 475,429 Swedish births.” Am J Epidemiol 177(6): 531-537. https://pubmed.ncbi.nlm.nih.gov/23425630/
- Okwaraji, Y. B., Suárez-Idueta, L., Ohuma, E. O., et al. (2023). “Stillbirths: Contribution of preterm birth and size-for-gestational age for 125.4 million total births from nationwide records in 13 countries, 2000-2020.” BJOG 2023. Epub ahead of print. https://pubmed.ncbi.nlm.nih.gov/38018284/
- Olesen, A. W., Basso, O., & Olsen, J. (1999). “An estimate of the tendency to repeat postterm delivery.” Epidemiology 10(4): 468-469. https://pubmed.ncbi.nlm.nih.gov/10401889/
- Olesen, A. W., Westergaard, J. G., & Olsen, J. (2003). “Perinatal and maternal complications related to postterm delivery: A national register-based study, 1978-1993.” Am J Obstet Gynecol 189(1): 222-227. https://pubmed.ncbi.nlm.nih.gov/12861166/
- Ota, E., da Silva Lopes, K., Middleton, P., et al. (2020). “Antenatal interventions for preventing stillbirth, fetal loss and perinatal death: An overview of Cochrane systematic reviews.” Cochrane Database Syst Rev 12(12): CD009599. https://pubmed.ncbi.nlm.nih.gov/33336827/
- Papageorghiou, A. T., Kemp, B., Stones, W., et al. (2016). “Ultrasound-based gestational-age estimation in late pregnancy.” Ultrasound Obstet Gynecol 48(6): 719–726. https://pubmed.ncbi.nlm.nih.gov/26924421/
- Paules, C., Dantas, A. P., Miranda, J., et al. (2019). “Premature placental aging in term small-for-gestational-age and growth-restricted fetuses.” Ultrasound Obstet Gynecol 53(5): 615–622. https://pubmed.ncbi.nlm.nih.gov/30125412/
- Rosenstein, M. G., Cheng, Y. W., Snowden, J., et al. (2012). “Risk of stillbirth and infant death stratified by gestational age.” Obstet Gynecol 120(1): 76-82. https://pubmed.ncbi.nlm.nih.gov/22914394/
- Savitz, D. A., Terry, Jr., J. W., Dole, N., et al. (2002). “Comparison of pregnancy dating by last menstrual period, ultrasound scanning, and their combination.” Am J Obstet Gynecol 187(6): 1660-1666. https://pubmed.ncbi.nlm.nih.gov/12501080/
- Schierding, W., Antony, J., Karhunen, V., et al. (2018). “GWAS on prolonged gestation (post-term birth): Analysis of successive Finnish birth cohorts.” J Med Genet 55(1): 55–63. https://pubmed.ncbi.nlm.nih.gov/29018042/
- Self, A., Daher, L., Schlussel, M., et al. (2022). “Second and third trimester estimation of gestational age using ultrasound or maternal symphysis-fundal height measurements: A systematic review.” BJOG 129(9):1447–1458. https://pubmed.ncbi.nlm.nih.gov/35157348/
- Smith, G. C. (2001a). “Use of time to event analysis to estimate the normal duration of human pregnancy.” Hum Reprod 16(7): 1497-1500. https://pubmed.ncbi.nlm.nih.gov/11425837/
- Smith, G. C. (2001b). “Life-table analysis of the risk of perinatal death at term and post term in singleton pregnancies.” Am J Obstet Gynecol 184(3): 489-496. https://pubmed.ncbi.nlm.nih.gov/11228508/
- Solé-Navais P, Flatley C, Steinthorsdottir V, et al. (2023). “Genetic effects on the timing of parturition and links to fetal birth weight.” Nat Genet 55(4): 559–567. https://pubmed.ncbi.nlm.nih.gov/37012456/
- Spong, C. Y. (2013). “Defining “term” pregnancy: Recommendations from the Defining “Term” Pregnancy Workgroup.” JAMA 309(23): 2445-2446. https://pubmed.ncbi.nlm.nih.gov/23645117/
- Stillbirth Collaborative (2011). “Association between stillbirth and risk factors known at pregnancy confirmation.” JAMA 306(22): 2469-2479. https://pubmed.ncbi.nlm.nih.gov/22166606/
- Taipale, P. & Hiilesmaa, V. (2001). “Predicting delivery date by ultrasound and last menstrual period in early gestation.” Obstet Gynecol 97(2): 189-194. https://pubmed.ncbi.nlm.nih.gov/11165580/
- Tveit, J. V., Saastad, E., Stray-Pedersen, B., et al. (2009). “Reduction of late stillbirth with the introduction of fetal movement information and guidelines – a clinical quality improvement.” BMC Pregnancy Childbirth 9: 32. https://pubmed.ncbi.nlm.nih.gov/19624847/
- Waller, J. A. & Saade, G. (2024). “Stillbirth and the placenta.” Semin Perinatol 48(1): 151871. https://pubmed.ncbi.nlm.nih.gov/38199875/
- Warland, J. & Mitchell, E. A. (2014). “A triple risk model for unexplained late stillbirth.” BMC Pregnancy Childbirth 14: 142. https://pubmed.ncbi.nlm.nih.gov/24731396/
- Weiss, E., Krombholz, K., & Eichner, M. (2014). “Fetal mortality at and beyond term in singleton pregnancies in Baden-Wuerttemberg/Germany 2004-2009.” Arch Gynecol Obstet 289(1): 79-84. https://pubmed.ncbi.nlm.nih.gov/23839535/
- Whitworth, M., Bricker, L., & Mullan, C. (2015). “Ultrasound for fetal assessment in early pregnancy.” Cochrane Database Syst Rev (7): CD007058. https://pubmed.ncbi.nlm.nih.gov/26171896/
- World Health Organization (WHO). (2022). WHO antenatal care recommendations for a positive pregnancy experience: Maternal and fetal assessment update: imaging ultrasound before 24 weeks of pregnancy. Geneva: World Health Organization. https://pubmed.ncbi.nlm.nih.gov/35442602/
- Yudkin, P. L., Wood, L., et al. (1987). “Risk of unexplained stillbirth at different gestational ages.” Lancet 1(8543): 1192-1194. https://pubmed.ncbi.nlm.nih.gov/2883499/
Birth Professionals:
Join others who also want to help bring evidence-based care to their local community.
Also, gain complimentary access to a printable library of our Signature Articles, 20+ hours of CE courses, a private community, and more.
Stay empowered, read more :
EBB 62 – Facing an unplanned Cesarean with parent Michelle Wilson
Don't miss an episode! Subscribe to our podcast: iTunes | Stitcher In this episode, I interview Michelle Wilson, one of the first parents to take the Evidence Based Birth Childbirth Class. Michelle has one son, Matthew, and is a stay-at-home mom in Berea,...

EBB 61 – Using Knowledge to Navigate Birth with New Parents Annamarie and Drew
Don't miss an episode! Subscribe to our podcast: iTunes | Stitcher In this episode, I interview AnnaMarie and Drew Stoudenmire of Greenville, South Carolina. They are parents to Otto - their first baby - who at the time of recording was only seven weeks old....
EBB 60 – Get to Know the New Evidence Based Birth® Childbirth Class!
Don't miss an episode! Subscribe to our podcast: iTunes | Stitcher In this episode, I interview EBB Instructors Cat LaPlante, Mary Kury, and Cindy Calvano about their experiences being among the first to teach the Evidence Based Birth Childbirth Class. Cat is a...